You cannot understand gold if you think it goes up and down, that the dollar is money and therefore the measure of all things, including gold. This is a very bold statement, so let’s look a little closer.
Mainstream articles often ask the question if gold is a good inflation hedge, which means: does gold go up as much as consumer prices. You know what comes next. They trot out a chart of the Consumer Price Index with the price of gold overlaid on it. And guess what. Gold fails to protect against inflation (i.e. its price does not go up with CPI). Therefore, you should buy stocks and real estate. QED.
A related error is to lump gold in with commodities such as copper (much less lumber or wheat). It is often supposed that commodities as a group should go up or down together. These can be correlated at times, but there is no law of the universe that makes it so. Every bushel of wheat, every barrel of oil, every board of lumber is produced in order to be used, consumed.
Supply and demand in the timber market, for example, can be visualized like a race between construction and forestry, with prices changing as one side and then the other gets ahead or falls behind. However, gold is produced to be held and not consumed. Virtually all of the gold produced over thousands of years is still in human hands. All of this gold is potential supply, under the right conditions.
There is simply no analogy between gold and any ordinary commodity.
Another related error is to plot the quantity of money with the price of gold. This one is not restricted just to mainstream paper bugs. Gold conspiracy theorists also use it. The price of gold does not track the dollar supply, therefore manipulation. As with commodity prices, there is no guarantee that the price of gold needs to track M0 or M2 or whatever favorite measure of the number of dollars.
Changing tacks, did anyone in Greece buy gold a month ago? If so, it surely wasn’t about rising consumer prices! For those not following the story, the Greek banks were closed and Greece imposed capital controls. Anyone who left euros on deposit in a Greek bank now faces uncertainty and threat of significant loss. Those with gold don’t have that worry.
Many analysts also chart the price of gold against the interest rate. “Does Gold Do Well When Rates Rise (or fall)?” they ask. A quick look through history show a rising price of gold during the 1970’s, along with a rising interest rate. In the 2000’s, there was a rising price of gold and a falling interest rate. The interest rate has been falling since 1981. In this period, there have been times when the price of gold was rising and others when it was falling.
These spurious correlations with the gold price remind us of superstitions like the Redskins Rule—if the Washington Redskins win their last home game before the election, then the incumbent party will win the presidential election. It is nothing more than the fallacy of cum hoc ergo propter hoc—a correlation between two events does not prove that one caused the other.
If you start with the assumption that gold goes up and down, then you won’t be able to understand the gold market, not to predict price moves nor understand them after the fact.
It is true—frustratingly, lamentably, damnably true—that the market quotes a price of gold in dollars. This is simply upside down. Suppose that you stretched three rubber bands to match the length of a steel rod. You would never say that the rod is three ‘bands long—not even if a million people started quoting rod length in terms of rubber bands. You wouldn’t wonder what makes the rod sometimes grow longer, and sometimes shrink. There is definitely no rod-shrinking cartel.
The dollar is, in realty, priced in gold. No matter how many folks argue otherwise. No matter how much they spend for a business suit, or how many TV programs interview them.
The dollar mostly goes down. At the inception of the Federal Reserve, the dollar was worth over 1500mg gold. At the low of 2011, it was around 16mg. So far, it has bounced to over 28mg.
Now, on to this week’s action. The price of gold is down 4 bucks, but the price of silver is up 13 pennies. Read on for the only accurate picture of the supply and demand conditions in the gold and silver markets, based on the basis and co-basis.
First, here is the graph of the metals’ prices.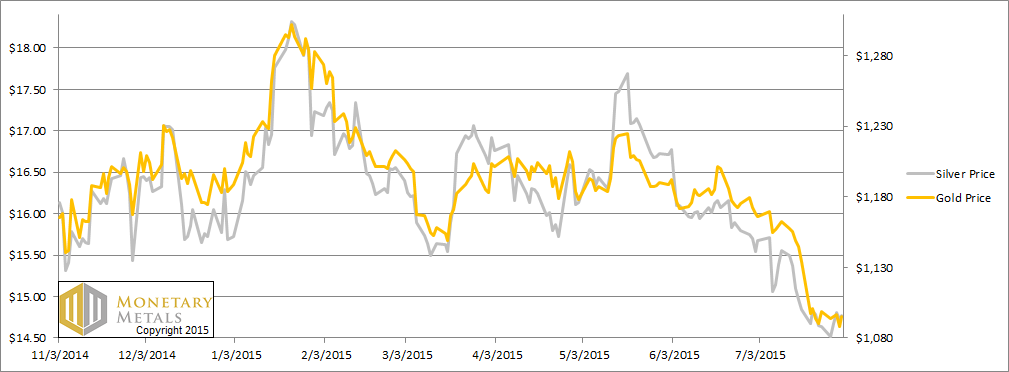
We are interested in the changing equilibrium created when some market participants are accumulating hoards and others are dishoarding. Of course, what makes it exciting is that speculators can (temporarily) exaggerate or fight against the trend. The speculators are often acting on rumors, technical analysis, or partial data about flows into or out of one corner of the market. That kind of information can’t tell them whether the globe, on net, is hoarding or dishoarding.
One could point out that gold does not, on net, go into or out of anything. Yes, that is true. But it can come out of hoards and into carry trades. That is what we study. The gold basis tells us about this dynamic.
Conventional techniques for analyzing supply and demand are inapplicable to gold and silver, because the monetary metals have such high inventories. In normal commodities, inventories divided by annual production (stocks to flows) can be measured in months. The world just does not keep much inventory in wheat or oil.
With gold and silver, stocks to flows is measured in decades. Every ounce of those massive stockpiles is potential supply. Everyone on the planet is potential demand. At the right price, and under the right conditions. Looking at incremental changes in mine output or electronic manufacturing is not helpful to predict the future prices of the metals.
Next, this is a graph of the gold price measured in silver, otherwise known as the gold to silver ratio. The ratio moved down this week.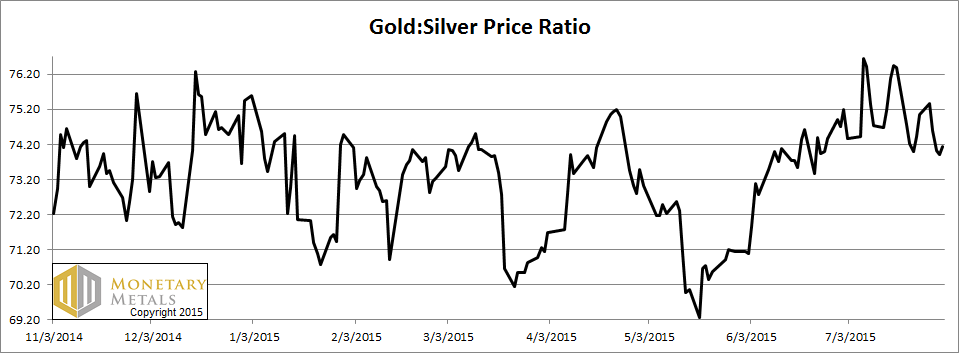
For each metal, we will look at a graph of the basis and cobasis overlaid with the price of the dollar in terms of the respective metal. It will make it easier to provide brief commentary. The dollar will be represented in green, the basis in blue and cobasis in red.
Here is the gold graph.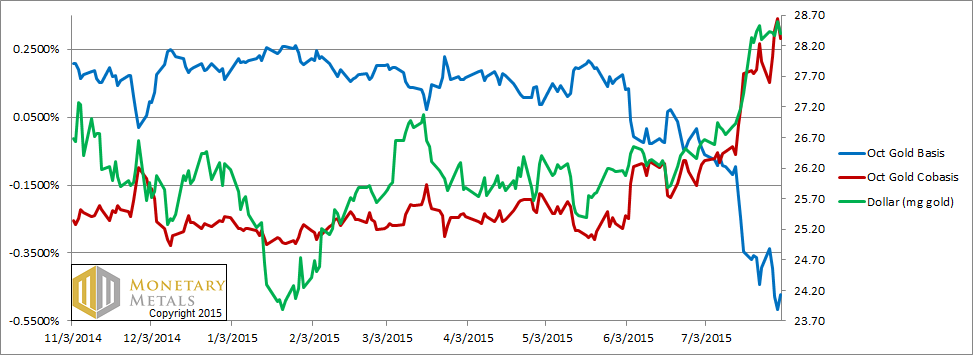
The price of the dollar rose a bit more (i.e. the price of gold fell). Again, along with this price move, the scarcity of gold rose.
The cobasis is the annualized rate one can earn by decarrying gold. Decarrying means to sell a bar and simultaneously buy a futures contract. The cobasis for October is about +0.3%. The cobasis for December is up to about +0.1%. And for February 2016, the cobasis is a mere -0.1%.
By the standard of the new normal, post 2008, this is not a crisis. However, by no means is it normal.
We calculate a fundamental price about a hundred bucks over the market price.
Now let’s look at silver.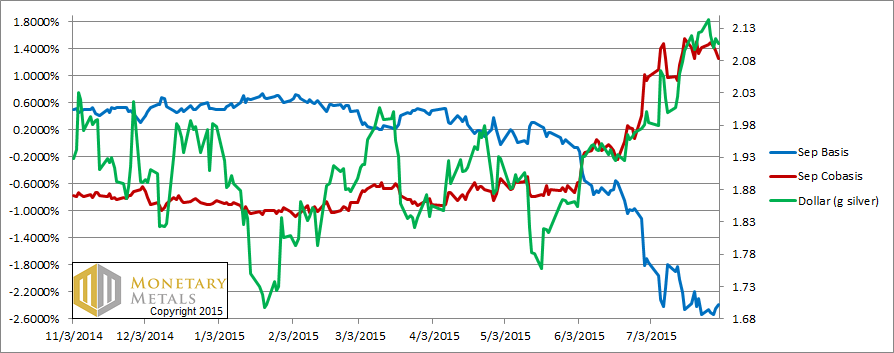
The silver price is up a bit (i.e. the price of the dollar, as measured in silver, is down 0.01g). Along with this price move, we see a drop in the scarcity (i.e. cobasis) of silver. The December silver cobasis, for comparison, is -0.3%.
The fundamental price in silver is now about a nickel above the market price. If there is a reason for caution regarding the price of gold, it is that the prices of the metals tend to correlate and with no fundamental reason to drive up the price of silver, that could act as a damper for the gold price. Of course, unless the fundamentals of gold weaken further, they will assert themselves at some point—forcefully. A hundred-dollar move would be over 9%.
Let’s end with a look at a long-term picture of the price of silver, measure in gold terms. This graph goes back to 1997.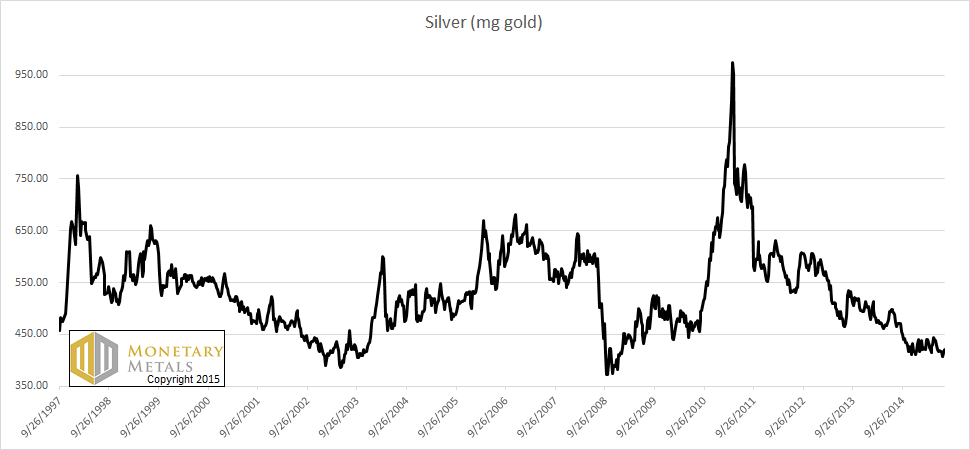
In this long view, we can see that the price of silver is close to a multi-decade low. Of course, it’s possible it could break down to new lows. But before we would subscribe to that view, we would need to see a driver for that to occur.
By the way, our fundamental price for silver in gold terms is around 385mg. The current market price is around 420mg. This is less than 10% downside.
