The Hoot
Actionable ideas for the busy trader delivered daily right up front
- Monday lower.
- ES pivot 2045.67. Holding below is bearish.
- Rest of week bias lower technically.
- Monthly outlook: bias lower.
- YM futures trader: no trade tonight.
Well the big Brexit bust exploded in everyone's face on Friday as traders and investors alike ran around all day like chickens with their heads cut off yelling "SELL SELL SELL!". I spent some time this weekend reading the commentary in the news and online. Before long, I'd gotten opinions that ranged the entire gamut from "no big deal" to "the End Days are upon us." No one, and I mean literally no one knows just what the eventual fallout from Brexit will be, me included.
I will simply point out the following facts: Friday's intraday low in the Dow was not lower than that on May 19th, just a little bit more than a month ago. The Dow is now still higher than its close on March 16th, a little more than three months ago. The EU dates back to 1957 when the Dow was trading at 4164. It got there from a level of 28 in 1896, through a Great Depression and two World Wars all without the help of the EU. Last Thursday, BB (Before Brexit), a day was 24 hours long and the sun rose in the east. Tomorrow, 3 days AB (After Brexit) I predict with some certainty that a day will be 24 hours long and the sun will still rise in the east.
So what is the Night Owl planning to do with her personal portfolio? Same thing I did going into the Great Recession in 2008: nothing. That worked out pretty well and this will too. Oh, and in case anyone is wondering, I was actually higher most of Friday due largely to my REIT's and a chunk of Altria (NYSE:MO) until the continuing slide into the end of the day left me with a 0.42% loss, a number that pales in comparison to my worst day this year, January 15th when I somehow managed to lose 2.74%, and it's certainly batter than the Dow's 3.39% plunge Friday. But I still ended the week last week up 0.58%, so I can't complain too much.
I'm not saying the selling's done yet, but maybe the charts hold some clues as to what will happen on Monday as we start the last week of June. So we set aside all the Nattering Nabobs of Negativity as well as the Pandering Pundits of Positivity, and examine the charts, which are the only facts we have.
The technicals
The Dow: We all know what happened Friday The Dow put in a giant red marubozu that broke monthly support at 17,435 and then kept right on going through the lower BB at 17,525 before finally stopping at 17,401, largely because the bell rang. That sent all the indicators lower and completed a bearish stochastic crossover. So there's clearly nothing bullish on this chart tonight.
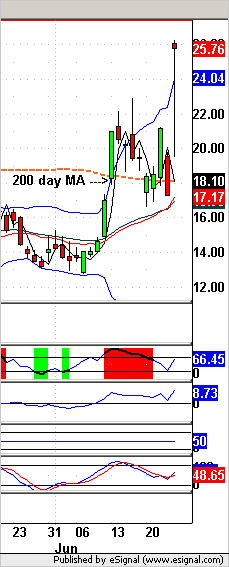
The VIX: This is worth a chart. On Friday the VIX rocketed up 49.33% for the tallest doji I've ever seen The really surprising thing here is that the VIX just barely hit 26 and didn't come close to the highs we hit back in January and February when we came close to 30 during the crises about ... uh yeah well I don't remember what seemed so important back then either anymore. Of note though is that this jump wasn't enough to send the VIX oversold and we also got a bullish stochastic crossover out of it, so I'm a bit wary of calling it lower on Monday despite the mega-doji.

Market index futures: Tonight, all three futures are lower at 12:24 AM EDT with ES down 0.42%. Last Friday, ES had its worst day since the Bronze Age crashing through support at 2060, then its lower BB at 2041, and finally support at 2029, and then testing its lower BB at 1999 before finally recovering a bit to 2018.50. Ordinarily, I'd say we'd be due for at least a DCB after a day like that, but we're gapping lower again in the new Sunday overnight, which all bodes poorly for Monday.
ES daily pivot: Tonight the ES daily pivot dives from 2100.67 to 2045.67. ES remains well below its new pivot so this indicator continues bearish.
Dollar index: And along with all the other extreme charts, the dollar was no exception Friday, zooming up 2.19% on a gap-up doji star that touched its upper BB. That completed a bullish stochastic crossover and very nearly sent it from oversold to overbought in just one day. The conventional wisdom here says that the dollar is due for retracement on Monday, but these are not conventional times.
Euro: And of course, the euro took a powder on Friday, travelling from upper BB to lower BB in one day. It also broke under its 200 day MA intraday before recovering a bit to close at 1.11555. But even that wasn't enough to send it oversold and indeed, in perhaps a sign of what's to come, it's continuing lower in the overnight, gapping right back down below its 200 day MA.
Transportation: The trans were hit even harder than the Dow on Friday, off 4.58%, also busting below their lower BB. But even that wasn't enough to send them oversold so amazingly I can't call a reversal here just yet.

It's hard to know exactly what to make of the charts tonight. They're all so overextended that it's hard to imagine not getting at least a DCB out of them. But it's also Sunday night and the futures are gapping down and not making any attempt at all to rally. And despite the big dump on Friday, amazingly the market indicators are not yet down to the oversold levels from which rallies spring. In particular, the SPX Hi-Lo indicator is at 77, nowhere near as low as it should be for a decent rally. I'd like to say the selling's over but I can't because I think we close Monday lower.
YM Futures Trader
No trade tonight.
