The Hoot
Actionable ideas for the busy trader delivered daily right up front
- Monday higher only if ES breaks above its pivot, else lower.
- ES pivot 2083.33. Holding below is bearish.
- Rest of week bias uncertain technically.
- Monthly outlook: bias lower.
- YM futures trader: no trade.
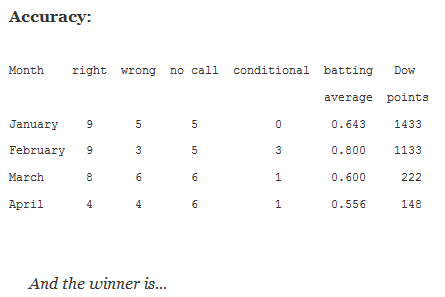
Last Thursday night we were once again unsure as to Friday's market direction and with the Dow ending just 21 points higher and the SPX essentially flat, it looks like "uncertain" was the right call. But we got some interesting candles along the way so let's take a look at them.
First though, I got a few questions the other day which I'll take a stab at here. First,
"How much higher could the Dow go?" Well it could go to the moon, Alice, but I don't think that's happening this year. We exited the long-running rising RTC off the 2009 bottoms nearly a year ago just short of 18,000 and that level has pretty much been resistance ever since. To resume the rally, people are going to need a reason to buy and looking around the globe right now, I don't see all that many. My best guess right now is that the Dow will end 2016 right around where it is now, close to 18K. I could be wrong. Lord knows I am often enough.
"And crude oil?" That's a tough one, since it involves a complex maze of interlocking geopolitical puzzles and I don't pretend to understand all of that. One thing's for sure though. It's hard to overestimate the hatred that exists between the Saudis and the Iranians. The Arabs are going to continue trying to stick it to Iran by holding oil prices down. Having the world's lowest production costs allows them to do that. Sure they're hurting compared to the good old days of $120 oil, but I'd be highly surprised to see oil end the year above $50. By the same token, I think we've already seen the lows of the year. I don't see oil falling back into the 20s again.
"How would one trade them now?" In a trendless market like we've got going this year, I think swing trading is the way to go using the candlesticks and regression trend channels as a guide. Keep seasonality in mind too. We're nearing the end of the best six months of the year and "sell in May" time is right around the corner.
Finally, I also got a question about not being able to click-to-expand a chart. Turns out that you can't expand images that are less than 100K in Blogger, and this one was. That doesn't make much sense to me, but then that's Google for ya. I'll try to make sure my charts are above this threshold from now on.
And now to the charts, Robin!
The technicals
The Dow: Friday's small gain came with a tomahawk (a hammer with a small upper shadow - my own invention). That's a bullish sign but the indicators are only just off of overbought and the stochastic remains in full-on bearish crossover mode. That said, the last two reversals were telegraphed pretty well by the candles.
The VIX: On Friday the VIX greatly underperformed the Dow with a 5.23% drop on an inverted hammer to fall right back down to month-long support just above 13. This tie though indicators are just off oversold and the stochastic is in bullish crossover mode so a move higher seems in order here.
Market index futures: Tonight, all three futures are lower at 12:25 AM EDT with ES up 0.69%. After a big drop last Thursday on Friday ES put in a stubby green hammer. Despite RSI and the stochastic both falling, I note that OBV continues to rise as it's been for two weeks now suggesting money flowing in. There was a wave of enthusiasm at the open Sunday evening which seems to be sagging a bit in the new overnight.
ES daily pivot: Tonight the ES daily pivot falls from 2088.50 to 2083.33. ES remains just below the new pivot so this indicator continues bearish.
Dollar index: Last Thursday night I wrote that "[a bunch of mumbo-jumbo] all looks like more upside on Friday"and wouldn't you know it, the dollar gapped up for a 0.54% pop on a stubby green spinning top to complete a bullish stochastic crossover and just clear week-long resistance. It's not 100% for sure but despite the gap below now there could be more upside available here given the room to run on the indicators.
Euro: Last Friday the euro completely discounted Thursday's tall doji as it plunged right back down to 1.12445 on a tall red candle that nearly hit its lower BB. And that job was just completed by the new Sunday overnight from which it seems to be bouncing off. The indicators are completely confused, with RSI and momentum rising but momentum and the stochastic falling. With Friday's big drop and the BB hit though, a DCB if nothing else could be in order on Monday.
Transportation: On Friday the trans retraced nearly all of Thursday's losses with a nearly one percent gain that handily outperformed the Dow's paltry 0.12%. But that leaves the indicators just falling off overbought and the stochastic in bearish crossover mode. Add in a rising RTC exit for a bearish setup and the majority of evidence suggests a move lower on Monday.

It's another strange night. We have a number of candlestick reversal signs on the charts but they are not supported by the indicators. That, plus the fact that ES is just grazing its new pivot as I write this makes it a good candidate for a conditional call: if ES remains below its new pivot by mid-morning (about 10:45 AM) Monday, we'll close lower. But if it manages to break above it by then, we close higher.
YM Futures Trader
No trade tonight..
