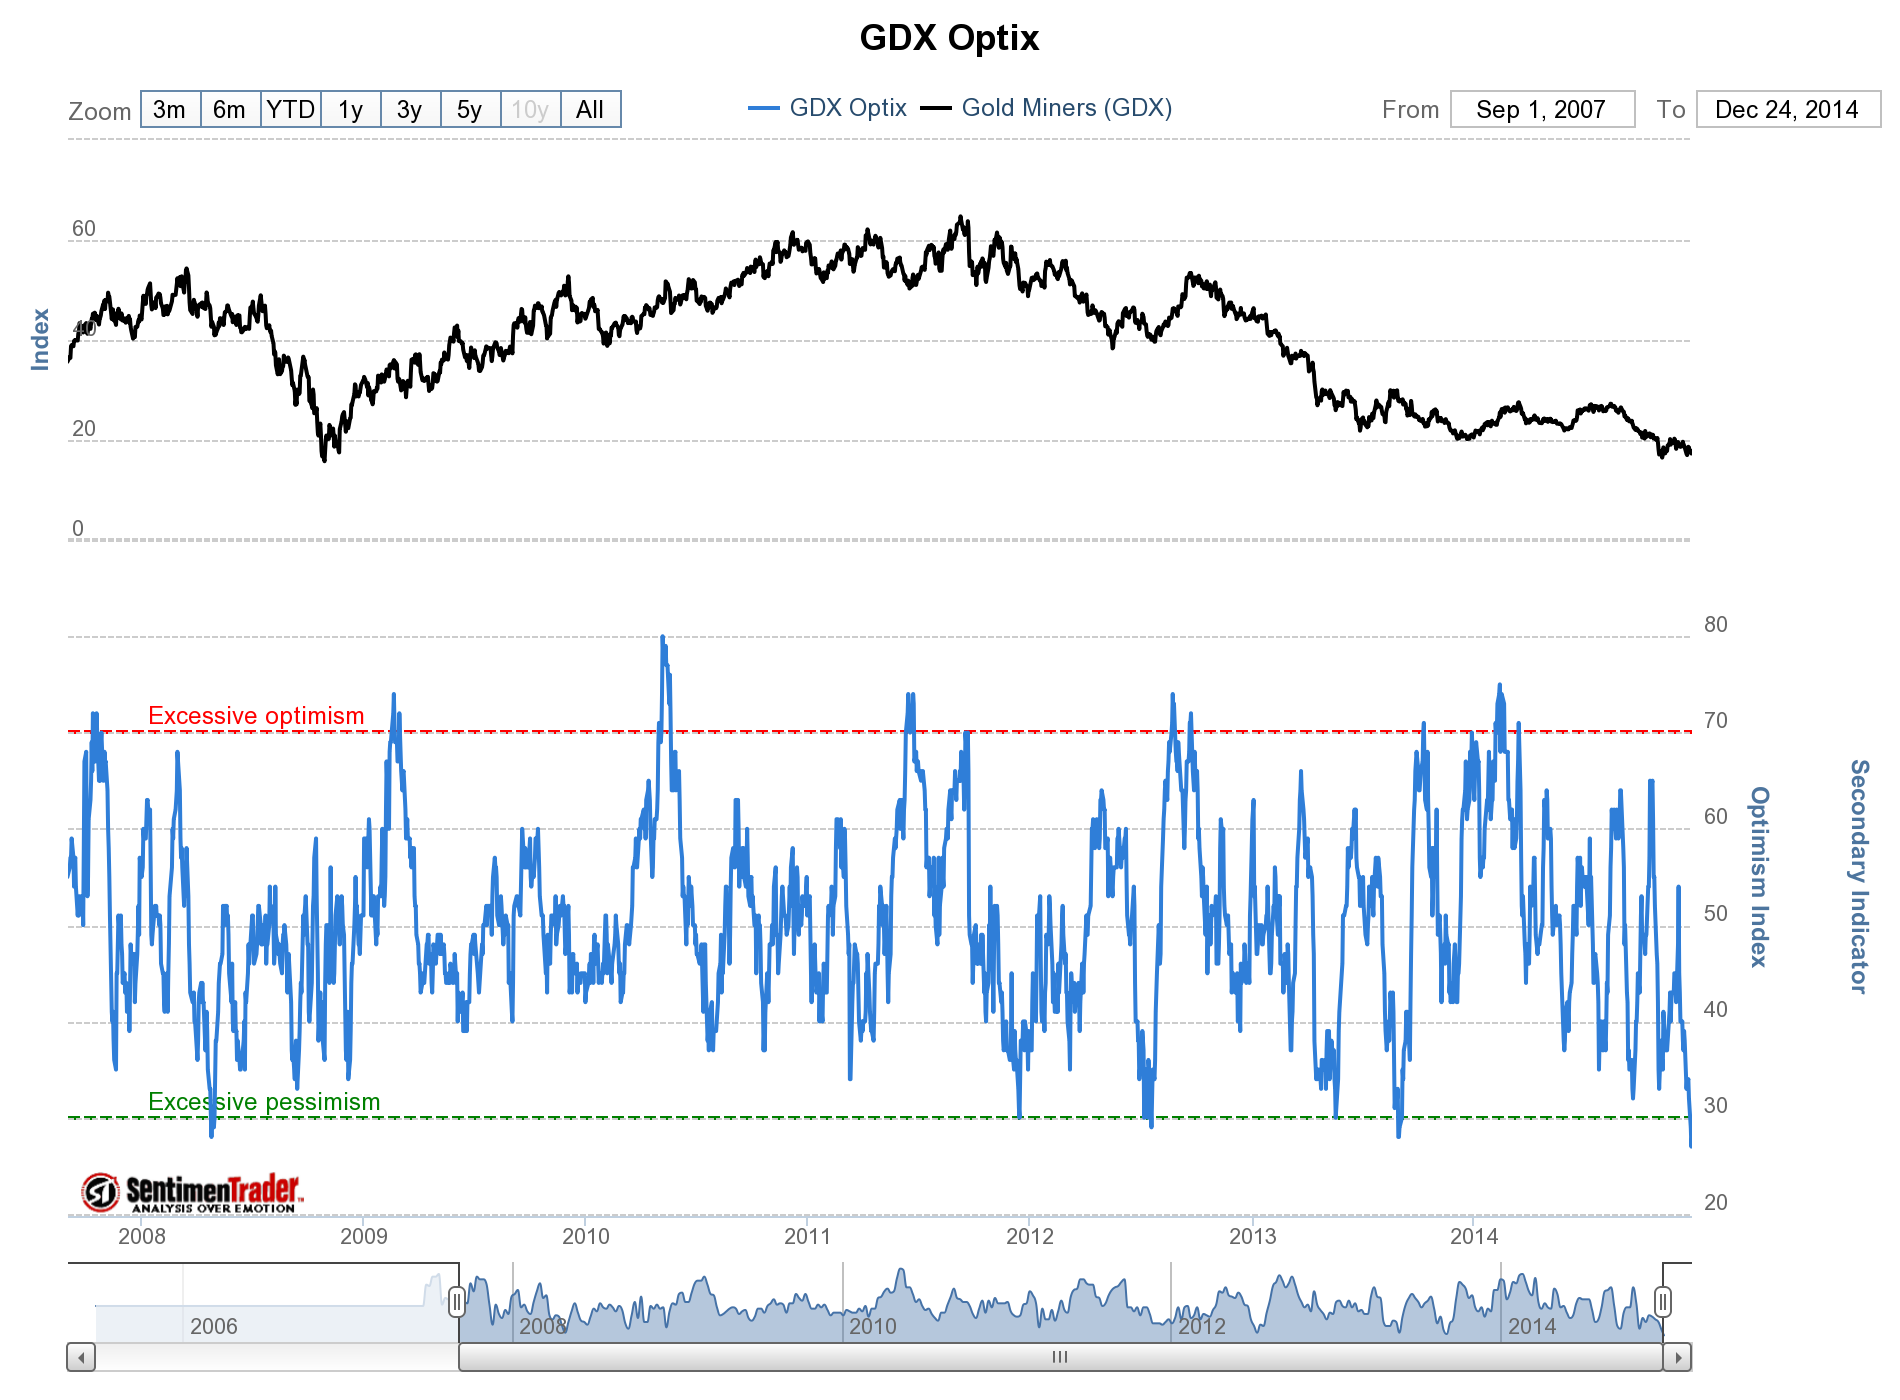
Another December and Gold stocks have reached another extreme oversold condition. This was the case precisely 365 days ago and the precious-metals complex, led by the miners rebounded strongly for nearly three months. A year later and the gold stocks are even more oversold. They’ve been in a bear market for more than three and a half years and in terms of price, are very close to matching the worst bear market of all 1996-2000. Only time will tell if this is truly the end of the bear market but in any case miners have a shot to start 2015 off positively.
The following sentiment indicator was developed by sentimentrader.com. For various ETFs it considers options activity, fund flows, the discount to NAV and future volatility expectations. Like any indicator, it is only a single indicator and is best used in conjunction with other indicators. Interestingly, the Optix for (ARCA:GDX) touched 27% two days ago -- the lowest since GDX began trading in 2006.
Breadth indicators also indicate an extreme oversold condition in the miners. The bullish percentage index (% of stocks on a P&F buy signal) for the GDM index (forerunner to GDX) is currently at only 3% but was at 0% at last weeks low. It has only ticked 0% a handful of times in the past two years. Second, the percentage of stocks in the HUI trading above their 200-day moving average is currently 6% but was 0% at last weeks low. The last time both indicators were at 0% together (as they were last week) was in late 2008.
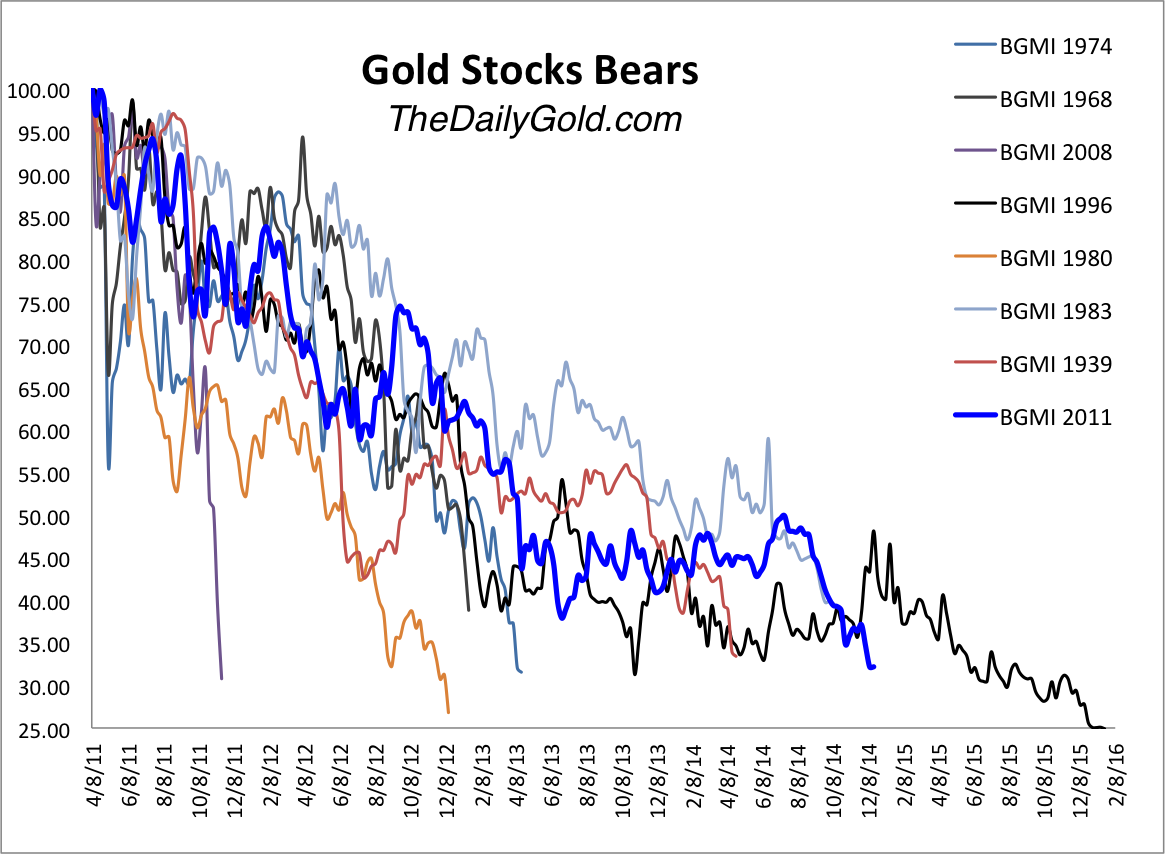
Here is a look at the updated bear analogs for the gold stocks. We use the Barron’s Gold Mining Index as it has the longest history. The current bear is in line with the 1996-2000 bear. After declining 69% over two and a half years that bear mounted a rebound that lasted over a year. That was followed by a decline to new lows. The current bear is down 68% and at this point on the scale is in the worst shape relative to all the other bears.
For further comparison to the 1996-2000 bear, consider the figures for the other indices. Back then, the XAU declined 73%. At its recent low, it was down 73%. Then the HUI declined 83%. It’s been down as much as 77% in this bear. The GDM index has lost 75% in this bear market and 77% in the 1996-2000 bear market. Meanwhile, (ARCA:GDXJ) has lost up to 86% in the current bear market.
As we noted last week, the miners appear to be holding their November low and have a tradeable setup. The HUI is trading between 155 and 175 while GDX is trading between 17 and 20. A short-term rally to resistance is definitely possible. Given the current extreme oversold condition, are the miners ready to rebound through resistance and rally the way they did last January? On the other hand, will the metals cooperate? After 2013 tax-loss selling, GDXJ rebounded over 50% within two months. We are working hard to prepare subscribers for this opportunity.
Good Luck!


