Here are a few mid-week thoughts on the dollar, bonds, industrial production, high yield, corporate profits and the upcoming NFP report.
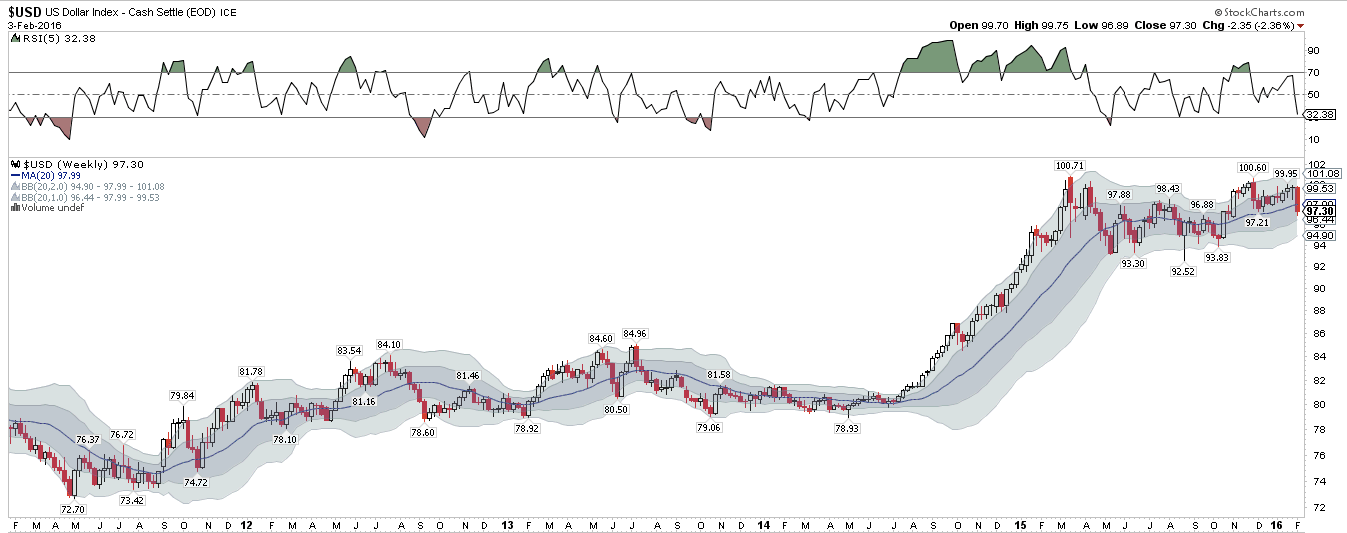
The dollar fell 1.6% yesterday. This sparked a rebound in US equities mid-day; The SPDR S&P 500 ETF (N:SPY) rose 2.5% from its intra-day low to close positive. In the bigger picture, the dollar index has been moving sideways since early 2015.
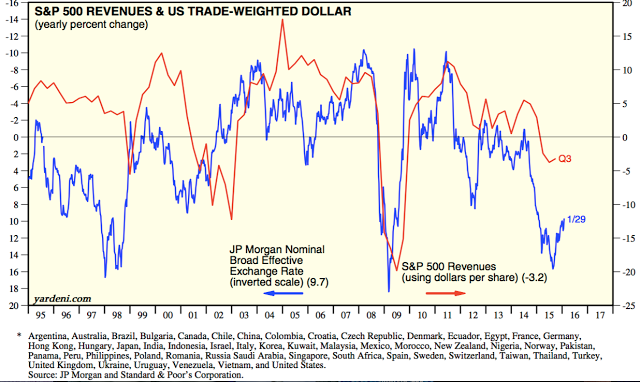
Why would equities rally on dollar weakness? A weaker dollar helps US exporters and also increases the value of repatriated profits from products sold overseas. There is a good inverse relationship between sales growth for large cap stocks and the dollar, meaning sales growth increases when the dollar declines (data from Yardeni).
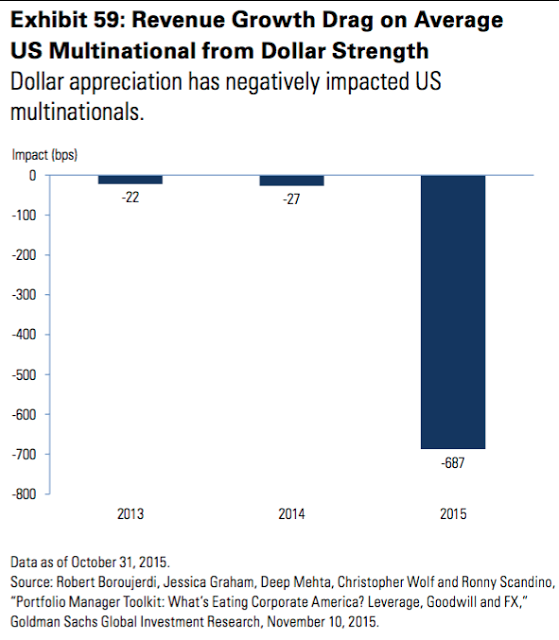
Dollar strength alone is estimated to have cost the average US multinational almost seven percentage points in revenue growth in 2015. For the core of the S&P 500, that suggests 3Q15's anemic 2% revenue growth would have been closer to 5% when adjusted for currency translation effects (data from GSIM).
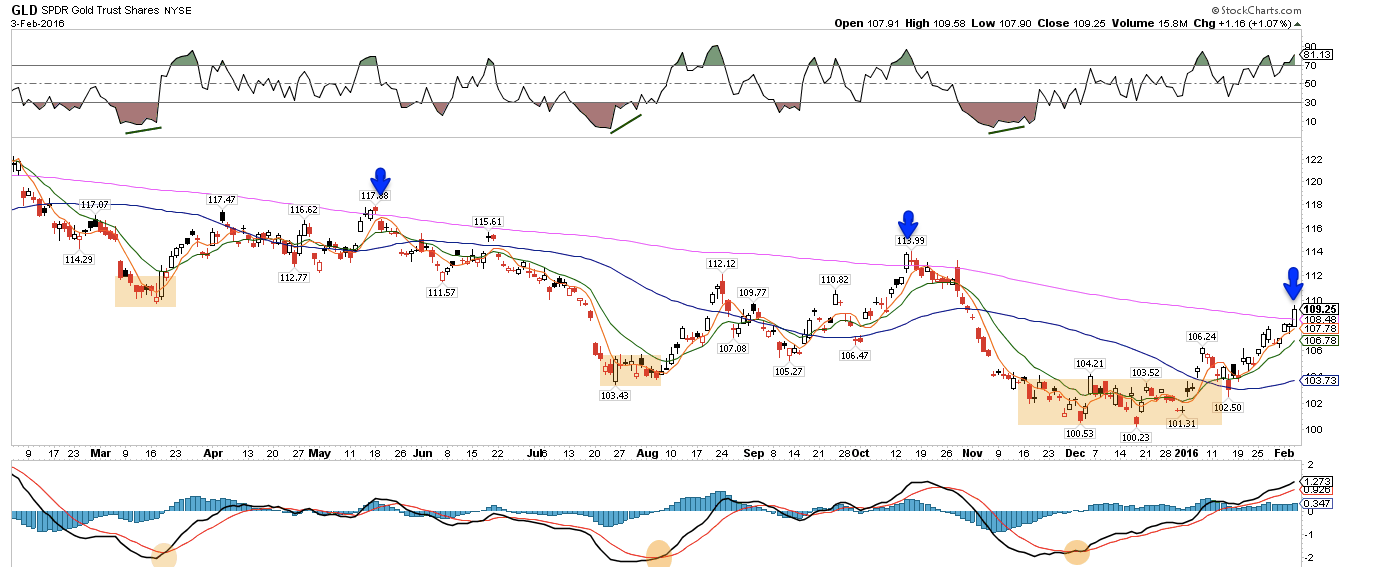
Gold has been moving higher over the past month. Gold gains strength when US rates fall and the dollar weakens. We've previously noted that gold (via SPDR Gold Shares (N:GLD)) formed a base (shaded box) and then broke out in early January. Yesterday, it reached its declining 200-dma. This is, interestingly, right where prior rallies in gold have stalled (arrows).
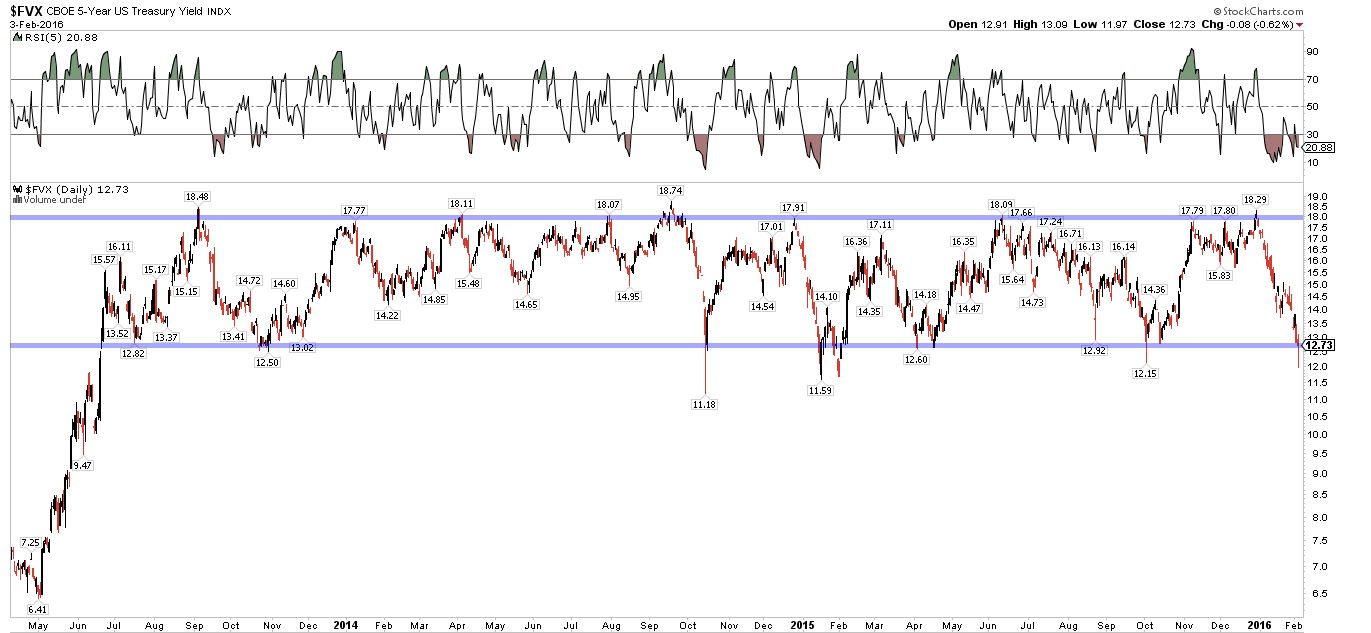
Treasury yields also reversed yesterday. Recall that investors have been pouring money into the safety of Treasuries over the past two months (post). Yesterday, 5-Year yields formed a possible reversal hammer on a level that has been support for 2 1/2 years.
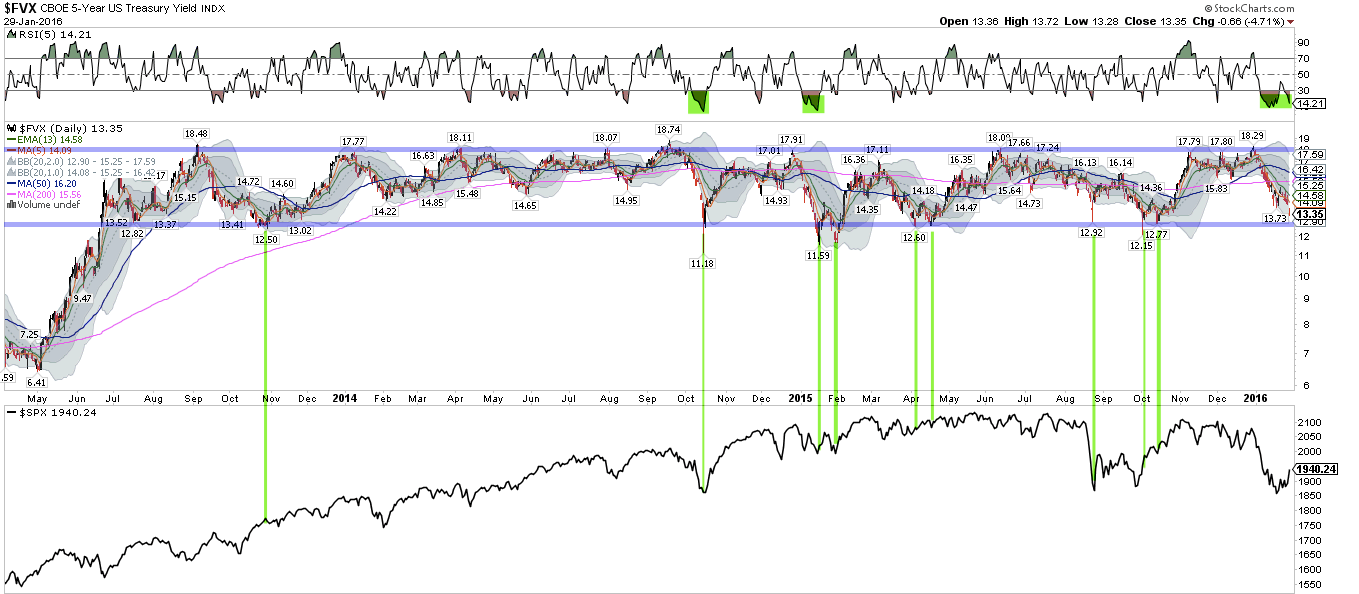
That could be significant for equities, since prior reversals in yields have corresponded with a trend higher in equities (lower panel), as money from Treasuries flows back into equities.
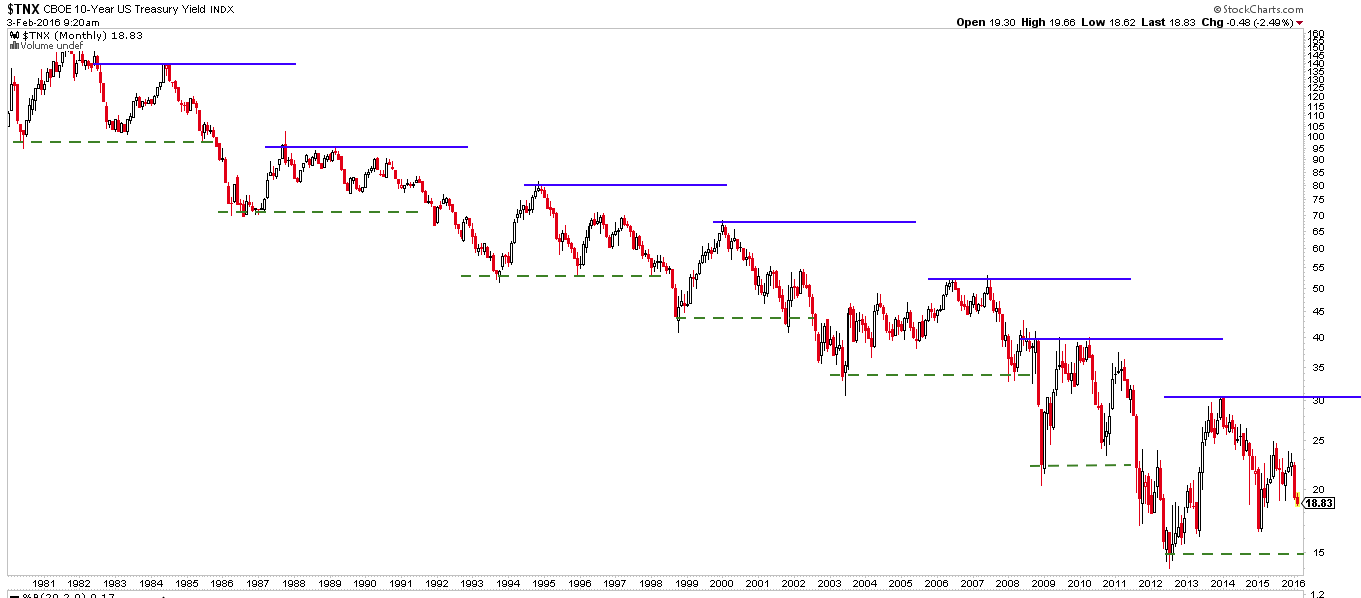
The broader trend in yields has been lower for more than 30 years, fitting with the pattern of lower inflation and lower demand growth. So it's surprising that pundits find concern in low yields, especially as (1) inflation remains very low and (2) 10-Year yields are higher now than they were in 2015, 2013 or 2012.
So, are low yields signaling an imminent economic contraction?
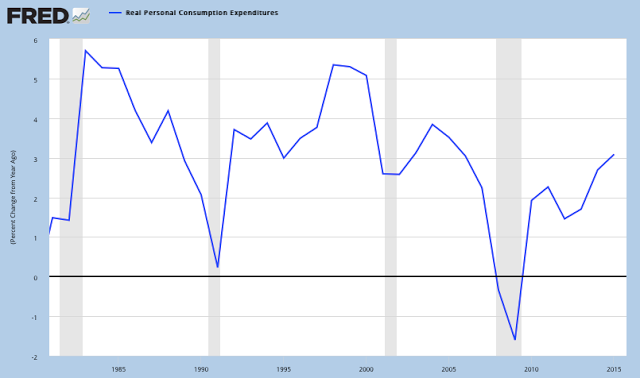
Maybe the US economy has already peaked, but personal consumption, the component that makes up 70% of GDP, grew the strongest in 10 years in 2015.
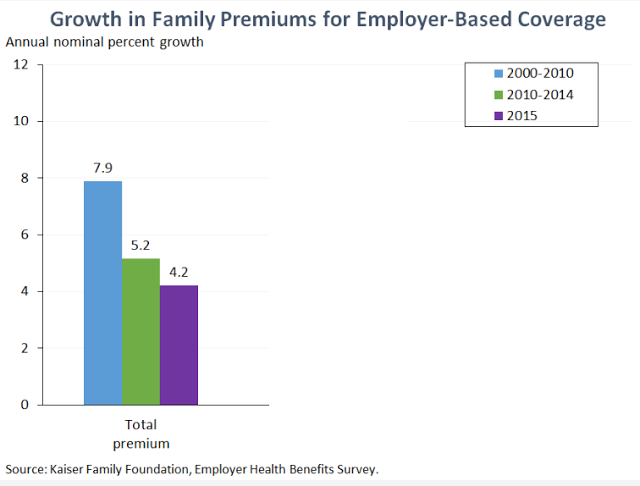
Consumption is not driven primarily by health care spending. In fact, premiums were growing at 8% per annum in the prior decade; that growth rate is now half as much and in-line with overall consumption growth.
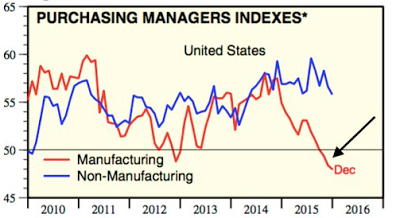
What has made many concerned about a looming recession is the weakness in manufacturing. Services growth seems healthy (data from Yardeni).
Josh Lehner:
"Right now industrial production is down nearly 2 percent over the past year. Every single time industrial production has been this negative in the past 40 years, the U.S. economy has already been in recession (article here)."
Morgan Stanley:
"Lower oil prices have clearly not been the economic boon many had previously assumed."
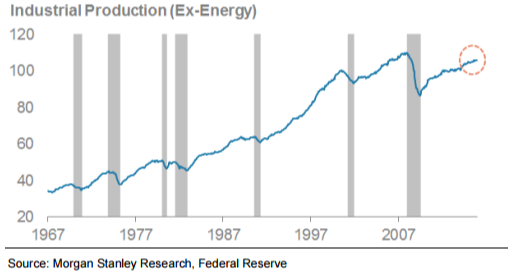
Note the recent fall in Industrial Production as energy prices have fallen (article here).
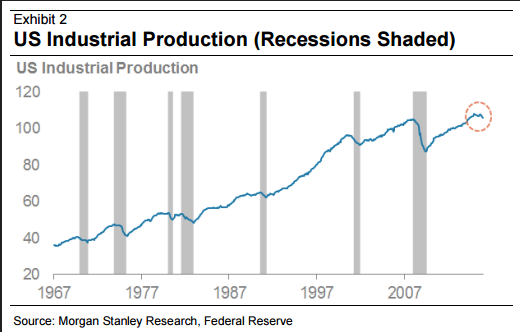
"But it is also important to recognize that many 'broad' measures of economic health, such as U.S. industrial production, can be significantly affected by weakness in oil."
Measures of Industrial Production continue to show growth outside of the energy sector. The decline, in other words, is sector-specific; it's not broad-based as it was prior to previous recessions.
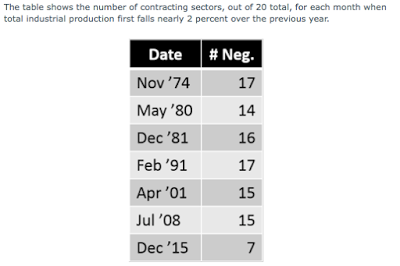
Tim Duy: "What makes a recession a recession is that the decline in (Industrial Production) activity is felt widely throughout the economy. In comparison to past recessions, the decline in manufacturing activity (now) is not well disbursed. During a recession, the vast majority of manufacturing industries are declining. We are nowhere near that point. In other words, even manufacturing - arguably the most distressed sector of the US economy - is not recession. And if manufacturing is not even in recession, it is difficult to see that the US economy is in recession. Or even nearing it (article here)."
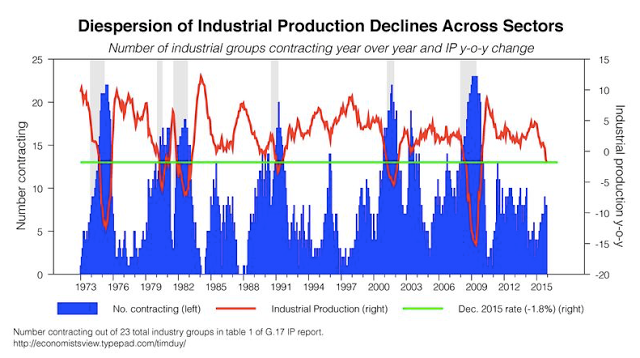
Josh Lehner: "Right now, 7 subsectors are contracting year-over-year, below what is typical in past recessions when 16 subsectors registered declines, on average. Taken together, this does paint a picture that is closer to an industry specific shock (in energy). The pain is not as widespread within industrial production (article here)."
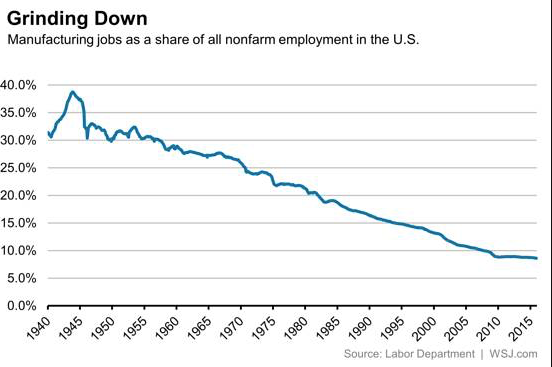
Manufacturing, moreover, continues to be of dealing importance to the US economy. US employment in manufacturing is less than 10% of the total (data from WSJ).
The sector-specific weakness seen in Industrial Production is also seen in earnings reports. This has, without a doubt, weighed on equity prices over the past year. No less than Jeff Gundlach has pointed out that the decline in profit margins has previously signaled most recessions.
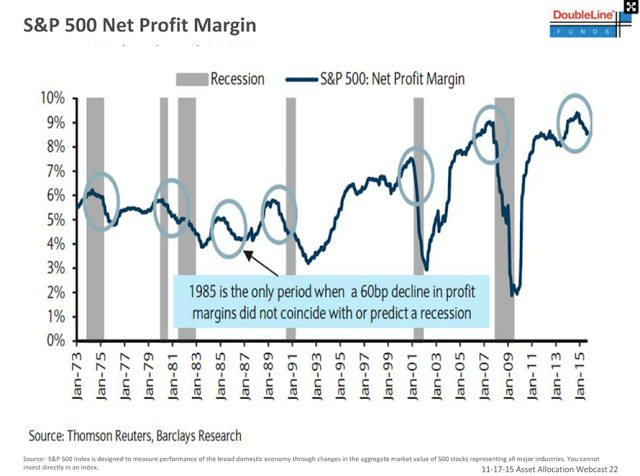
The indicated exception in the chart above is 1985. What happened in 1985 that caused margins to decline while the economy did not tip into recession? Two things: energy prices fell 65% and the dollar reached its all-time peak. This is remarkably similar to today's situation.
Morgan Stanley: "We commonly hear that corporate earnings are 'rolling over. It may be more accurate to say that commodity sector earnings are collapsing, while profits for the remainder of the market are still posting moderate growth." Like Industrial Production, earnings weakness is largely sector-specific (to energy), not broad-based.
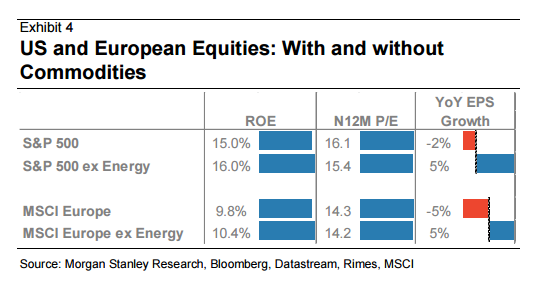
Operating profit margins increased slightly in the past year, to 9.6%. The main drag on margins has been energy; energy margins fell from nearly 6% to under 3%. Other sectors saw margins expand. Without the drag from energy, SPX margins would have increased to 10.6% in 4Q15 (data from S&P).

And, of course, falling energy has blown out spreads for high yield debt, raising worries that a more serious debt crisis is around the corner.
Deutsche Bank:
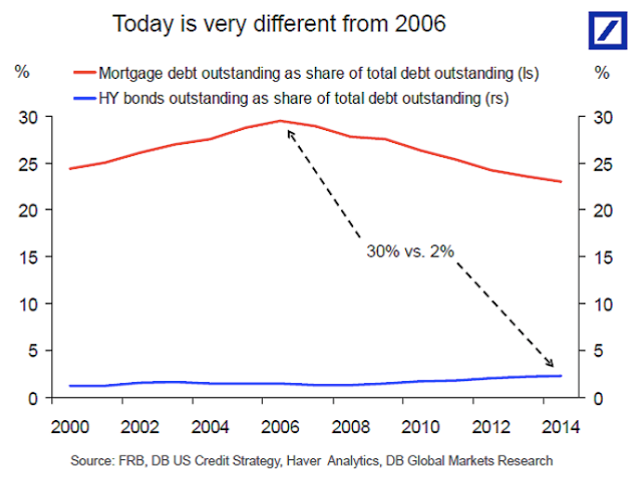
Falling energy prices have had an exaggerated affect on high yield spreads. But the risk is nothing like that of mortgages which brought on the Great Recession. Today's high yield debt exposure is 1/15th the size of mortgage debt in 2006 (article here).
Similarly, as Matthew Klein points out (article here):
"The problems in oil could cause trouble if losses on energy junk bonds reduce investor demand for auto ABS and if losses on bank loans to energy companies cause them to retrench in both vehicle and mortgage lending.
According to CreditSights, the face value of high-yield bonds to energy companies is slightly under $200 billion, and investors who mark their holdings to market have already experienced losses of about 33 per cent. For comparison, the US corporate debt and asset-backed securities market is worth more than $11 trillion. Meanwhile, US banks have lent about $105 billion to energy companies.
The small size of this exposure, the structure of the loans, and the particular types of companies doing the bulk of the borrowing all make the risk to bank balance sheets relative low."
Finally, by now it is well understood that high yield spreads outside of the energy sector are not signaling a notably high risk of recession. That point has been made in this site, by high yield authority Martin Fridson (article here) and most recently by the top-performing junk bond manager over the past 5 years (article here).
Overall GDP in 4Q15 grew 1.8% (real) over the past year. Importantly, residential investment grew at an annual rate of 8%.
Bill McBride:
"Residential investment (housing) tends to lead the economy. Residential Investment as a percent of GDP has been increasing, but is only just above the bottom of the previous recessions - and I expect RI to continue to increase for the next few years (article here)."
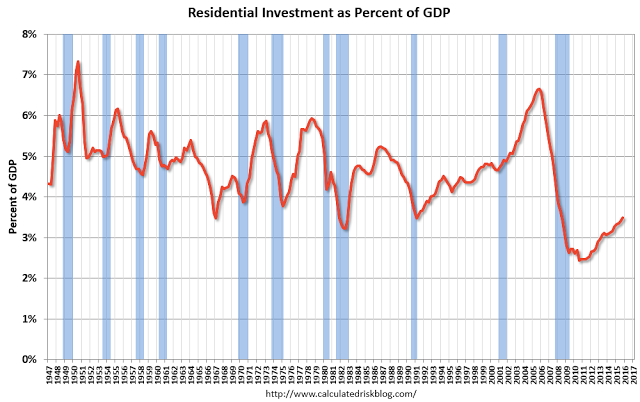
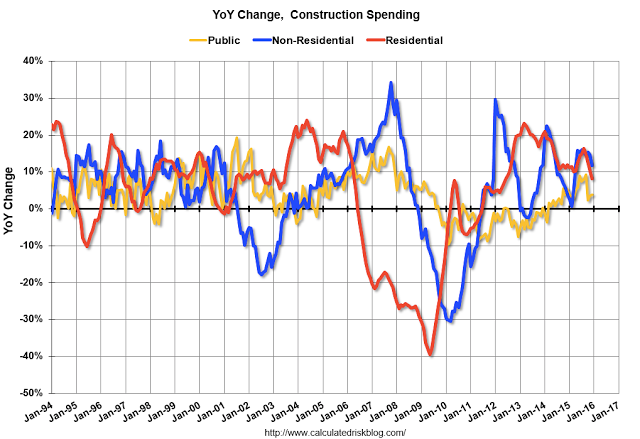
It's not just residential investment that's growing strongly. Non-residential construction grew 11% yoy and public spending on construction grew 4% yoy. Overall, construction spending grew nearly 11% in 2015 (article here).
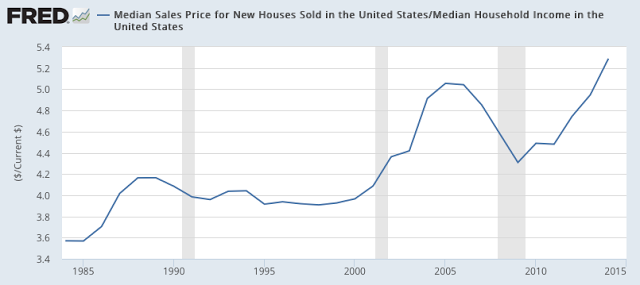
If there's a threat to housing, it's affordability. The last housing cycle peaked when homes became extremely unaffordable (home price relative to income). Affordability is less attractive now. Continued high prices, on the other hand, incentivize builders and also show robust demand with little inventory.
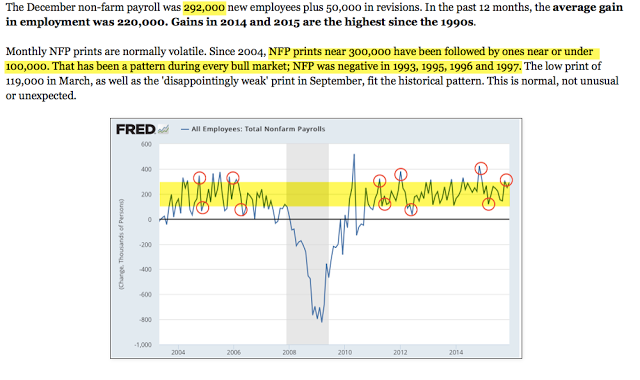
Last thought: January non-farm payrolls will be released on Friday. The consensus expects 188,000 new employees. This comes on the heels of three strong months of employment gains at or near 300,000/month. In the past, strong NFP prints like this have consistently been followed by ones near or under 100,000. If there is a big miss in NFP this week, don't be alarmed. This is nothing unusual.
