
Microsoft Corporation (NASDAQ:MSFT) reported first-quarter fiscal 2017 earnings adjusted for Windows 10 deferrals and currency effect of 76 cents per share, which comfortably surpassed the Zacks Consensus Estimate of 68 cents.
Revenues (adjusted for Windows 10 deferrals) of $22.33 billion dipped 1.4% sequentially but up 3.1% from the year-ago quarter (up 5% in constant currency or CC) and the Zacks Consensus Estimate of $21.54 billion.
Encouragingly, annuity-based revenue continued to grow, offsetting declines in transactional revenue indicating that the user base continues to migrate to the cloud. Notably, commercial cloud annualized revenue run rate exceeded $13.0 billion at the end of the quarter.
However, increased investment in the cloud impacted margins along with unfavorable foreign exchange.
Shares surged almost 6% in after-hour trading.
Segment Details
Productivity & Business Processes includes the Office and Dynamics CRM businesses. Revenues slipped 4.5% sequentially but increased 5.6% (up 8% CC) on a year-over-year basis to $6.66 billion.
The Commercial business (products + Office 365 & related cloud services) revenue was up 5% from year-ago level (up 8% CC). Office 365 saw commercial seat growth of 40% from the year-ago quarter. This is an area of tremendous focus with reselling partners up to 90K in the last quarter as Microsoft goes all out to target the SMB segment.
Monthly active users of Office 365 commercial increased 40% year over year to more than 85 million. The company continues to win customers like eBay (NASDAQ:EBAY) , Allergen, Exelon (NYSE:EXC) and Liberty Mutual Insurance. Office 365 commercial revenue soared 51% (up 54% in CC) from the year-ago quarter.
The Consumer business revenue grew 8% (8% CC) year over year in the quarter. Office 365 consumer subscriptions are now at 24 million, up from 23.1 million in the previous quarter.
Dynamics and cloud services revenue jumped 11% (13% CC). Management noted that more than 70% of new Dynamics enterprise customers are choosing Dynamics online. The company mentioned HP Inc., which is replacing its CRM systems with Dynamics 365 to take advantage of the built-in intelligence feature.
Intelligent Cloud includes server and enterprise products and services. The segment reported revenues of $6.38 billion, which was down almost 5% sequentially but improved 8.3% (up 10% in CC) year over year.
Server product and cloud services revenue went up 11% year over year (up 13% in CC). Annuity revenue grew double-digits while transaction revenue declined.
The high point was Azure revenue, which soared 121% CC year over year, with Azure compute usage doubling. Microsoft is benefitting from its hybrid and hyperscale cloud, which spans multiple jurisdictions, making it ideal for multinational companies and banks that have operations all over the world and are required to be in compliance with laws of the countries in which they operate.
This is the reason Microsoft cites that has drawn 80% of the world’s largest banks to Azure. Moreover, the company’s expanding cloud services have also helped it to capture big customers like Boeing (NYSE:BA), Rolls-Royce (LON:RR), Schneider Electric (PA:SCHN) and Facebook (NASDAQ:FB).
Microsoft continues to expand its data center footprint. The company recently announced its plan to build data centers in France so as to provide Azure, Dynamics 365 and Office 365 services to the French populace by the beginning of next year.
The expansion will help Microsoft to compete Amazon.com (NASDAQ:AMZN) , which also intends to open an Amazon Web Services (AWS) Region in Paris in 2017. (Read More: Amazon and Microsoft Take Their Cloud Battle to France).
Additionally, partnerships with Adobe (NASDAQ:ADBE) and SAP will augment Microsoft’s competitiveness in the cloud. Moreover, Enterprise Mobility customers soared 85% to over 37K with the installed base growing 2.5X as compared with the year-ago quarter.
Enterprise Service revenue inched up 1% (2% CC) in the reported quarter.
More Personal Computing comprises mainly the Windows, Gaming, Devices and Search businesses Revenues increased 4.5% sequentially but slipped 1.8% (1% CC) year over year to $9.29 billion.
Windows OEM Pro revenue increased 1% year over year (due to stabilization in the commercial PC market in the U.S.). Non Pro revenue declined 1% (on the back of a higher premium mix) from the year-ago quarter.
Windows commercial products and cloud services revenue was flat on a year-over-year basis (up 2% in CC) driven by annuity revenue.
Gaming revenue dropped 4% in CC; Xbox Live monthly active users were up 21% to 47 million. The company witnessed more than 20 billion hours of gameplay on Windows 10 PCs and tablets; more than 500% jump on a year-over-year basis.
During the quarter, Microsoft acquired Beam Interactive, which specializes in live-streaming technology for gamers.
Phone revenue plunged 71% in CC while Surface revenue grew 39% in CC from last year driven by Surface Pro 4 and Surface Book. Net revenues declined 25% in CC.
Search ex-TAC revenue grew 9% (10% CC) as both search volume and RPS improved.
Operating Results
Microsoft’s gross margin of 61.6% surged 40 basis points (bps) sequentially but down 300 bps from the year-ago quarter (gross profit dollars were almost flat sequentially but dropped 4.3% year over year).
The growth in gross profit dollars by segment was as follows: Productivity up 2% CC (increased mix of cloud offerings and investments in cloud were drivers), Intelligent Cloud 4% CC (again a result of increased mix of cloud offerings) and More Personal Computing 1% CC (search and Windows OEM were drivers neutralized by phones and Xbox).
MICROSOFT CORP Price, Consensus and EPS Surprise
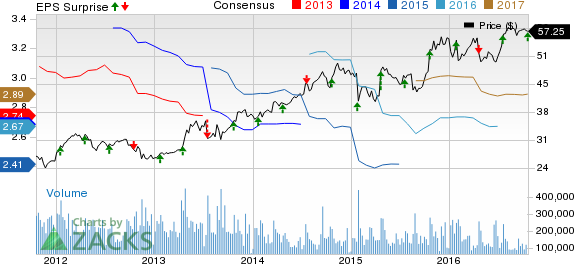
MICROSOFT CORP Price, Consensus and EPS Surprise | MICROSOFT CORP Quote
Operating expenses (excluding Impairment, integration, and restructuring costs) of $7.38 billion were down 12.6% sequentially but were flat from the year-ago quarter. However, as percentage of revenues, operating expenses decreased 490 bps sequentially but increased 10 bps on a year-over-year basis.
As a result, operating margin expanded 520 bps sequentially but contracted 290 bps on a year-over-year basis to 25.5%.
The operating margin by segment was as follows: Productivity 46.9% (up 380 bps sequentially but down 320 bps year over year); Intelligent Cloud 32.2% (down 40 bps sequentially and 830 bps year over year) and More Personal Computing 20.7% (up 990 bps sequentially and 460 bps year over year).
Balance Sheet
Microsoft ended with cash and short term investments balance of $136.9 billion, up $23.69 billion during the quarter. The net cash position was around $62.24 billion ($7.90 a share), up from $59.55 billion ($7.58 a share) at the beginning of the quarter.
In the last quarter, Microsoft generated $11.5 billion in cash flow from operations, spent $3.6 billion to repurchase shares and $3 billion to pay dividends. The company raised its quarterly dividend by 8% to 39 cents.
Acquisitions and Divestitures
Meanwhile, Microsoft continues to anticipate closing the acquisition of LinkedIn Corp (NYSE:LNKD) in second-quarter fiscal 2017. Additionally, the company expects to complete the sale of its entry-level feature phone business during the quarter.
Guidance
Management said that FX would have a negative 1-point impact on revenue growth in second-quarter fiscal 2017 at both the total company and individual segment levels.
For the second quarter, Microsoft expects Productivity & Business Process revenues of $6.9–$7.1 billion, Intelligent Cloud revenues of $6.55–$6.75 billion and More Personal Computing revenue of around $11.2–$11.6 billion. This implies total revenues of between $21.05 billion and $21.25 billion.
Microsoft expects COGS of $9.7–$9.9 billion, operating expenses of $7.85–$7.95 billion and other income/expense of almost $150 million.
Management said that 2017 operating expenses would be $31.1–$31.4 billion as investments in strategic growth opportunities continue. The non-GAAP tax rate is expected to be 20% (+/-2%) depending on the variability of factors such as mix of services revenue versus licensing revenue, the geographic mix of revenue and the timing of equity vests. A higher mix of cloud revenue is also anticipated to increase the tax rate.
Zacks Rank
Microsoft shares carry a Zacks Rank #3 (Hold). Amazon.com is a better-ranked stock with Zacks Rank #1 (Strong Buy). You can see the complete list of today’s Zacks #1 Rank stocks here.
Confidential from Zacks
Beyond this Analyst Blog, would you like to see Zacks' best recommendations that are not available to the public? Our Executive VP, Steve Reitmeister, knows when key trades are about to be triggered and which of our experts has the hottest hand. Click to see them now>>
AMAZON.COM INC (AMZN): Free Stock Analysis Report
EBAY INC (EBAY): Free Stock Analysis Report
MICROSOFT CORP (MSFT): Free Stock Analysis Report
ADOBE SYSTEMS (ADBE): Free Stock Analysis Report
Original post
Zacks Investment Research