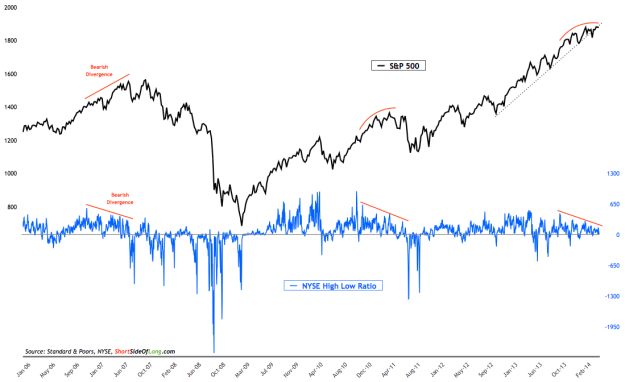
Chart 1: NYSE high/low ratio is resembling a pattern similar to ’07 & ’11!
Source: Short Side of Long
The recent NYSE 52 week new highs and lows data continues to show bearish divergence which was last discussed last over the past few months. The chart above displays a rising broad market, while the number of new highs relative to new lows is slowly but surely decreasing. We have seen similar market breadth conditions to these near major market peaks before. These include the peaks in 2007 and 2011.
Consider that in late December 2013, the NYSE ratio between new highs and lows stood at 319 as the S&P 500 flirted with 1,850. While the S&P rallied towards a higher high in March of this year, the breadth ratio only managed to post a reading of 291. Recent record intra day highs at 1,902 on the S&P have proceeded with an even lower ratio numbers of 151.
The current bearish breadth divergence between the rising index and fewer new highs has actually been in progress for several months now (since October 2013) and is usually a warning signal of a possible market top.
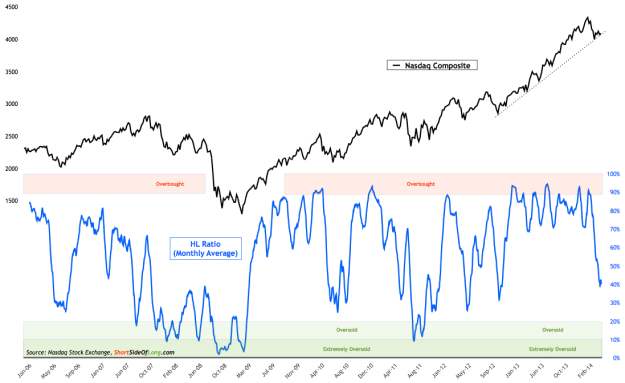
Chart 2: Last month's technology breakdown is not yet oversold
Source: Short Side of Long
With a strong sell off in the NASDAQ, certain market analysts have concluded that the beaten down names have now become bargains. Personally, I am not so sure about that. The Nasdaq has been in an exponential rise up to this point, coupled with weakening breadth. As that trend broke down over the last several months, I doubt the recovery will be anything but swift.
Usually, but not always, the market takes its time to consolidate or even become oversold, as it swings from positive to negative expectations. Furthermore, investors should keep in mind that since the Nasdaq has led the bull market since March 2009 lows, it could also be a leader into the next downturn.
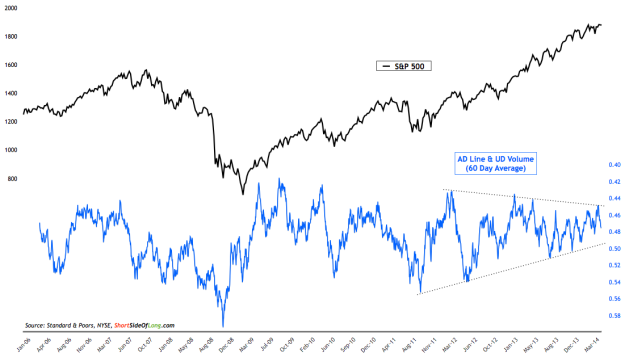
Chart 3: Long term advance/decline line is triangulating as the rally pauses
Source: Short Side of Long
Recent advancers vs decliners have been rather weak, as the S&P 500 continues its consolidation with no major progress since the Fed taper was announced. While the cumulative AD line continues to rise, the strength from the 5 day, 10 day and 21 day AD lines are all quite weak. In other words, recent internals have not been that strong, despite the fact that S&P 500 is only 1% from its record highs.
Moreover, the chart above shows breadth accumulation and distribution over the longer term (3 month average). Interestingly, for reasons unknown to me, the advancers vs decliners have been triangulating into a more narrow range. I believe a decision out of this technical setup could impact the stock market in a more meaningful way, so this chart stays on my watch list in coming months.
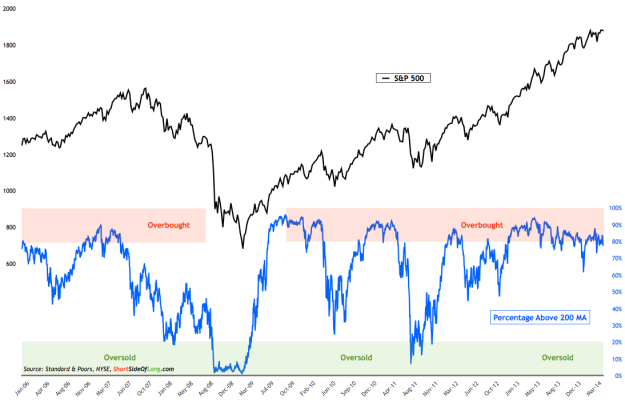
Chart 4: US equities remain overbought from the long term perspective
Source: Short Side of Long
Even though the average stock within the S&P is actually down by a handful of percentage points while the index itself trades at near record highs, it is important to underline the fact that the market is not ripe for a buying opportunity. We are not oversold from the long term perspective.
Obviously, traders will argue differently, but my style is one of longer term investment. Great buying opportunities presented themselves during Nov ’08 to Mar ’09 and from Aug ’11 to Oct ’11. At present, the market actually remains quite overbought and overextended for a rather long period already. If anything, we are overdue for some meaningful selling.
Chart 5: Weakness is now more pronounced with stocks above 50 MA
Source: Short Side of Long
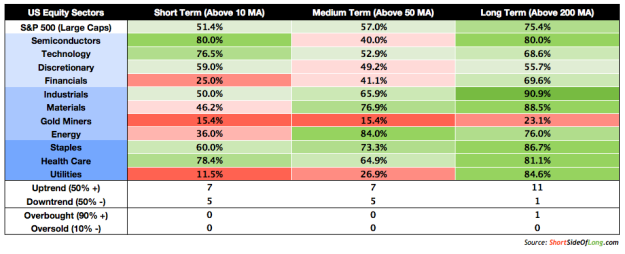
Breaking down the breadth strength in S&P sectors, we can see that long term readings remain in the uptrend (apart from Gold Miners). While some are weaker than others, majority of the participation is coming from late cyclicals (Industrials) and defensives (Utilities).
At the same time, early cyclicals and economically sensitive sectors have shown signs of weakness. Sectors like Technology, Consumer Discretionary and Financials are also not confirming record highs in the Dow Jones and S&P 500. Historically, similar conditions have occurred near major market peaks in 2000, 2007 and 2011. I guess, this is yet another reason to be cautious.

