Get 40% Off
🚨 Volatile Markets? Find Hidden Gems for Serious OutperformanceFind Stocks Now

Marking 5 Years Of Pain In BP With A Bullish Trade

Published 04/21/2015, 01:01 AM
Updated 05/14/2017, 06:45 AM

BP (LONDON:BP) Amoco is marking 5 years since the Deep Water Horizon explosion in the Gulf of Mexico today. A lot has happened since then. Crazy attempts to stop the leak. Horrible pictures of wildlife during the initial clean up. A CEO found lounging on yachts unconcerned gets the boot. And billions of dollars in fines.

Through this the stock collapsed initially and then recovered to a stable area. In 2013 it started moving back higher, only to peak in July and start falling back again with the collapse in oil prices. This company cannot catch a break. But that long string of badness may be about to end.
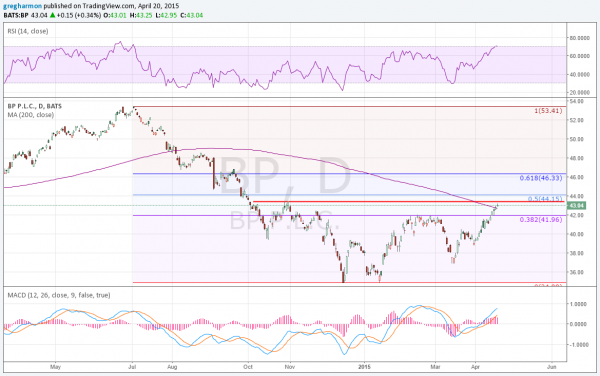
BP Daily Chart

The chart above tells why. First the stock price moved above the 200 day SMA, a bullish signal, for the first time since August 2014. The stock price is also fast approaching the 50% retracement of the move lower last year, and with the 61.8% level at 46.33 above. The momentum indicators are bullish as well, with the RSI nearing overbought levels while the MACD moves higher. Finally there is the chart below as well. The 3-box reversal Point and Figure chart, shows that the stock is on the cusp of a break out. A print of 44 would push it over the falling trend resistance, towards the bullish price objective of 56.
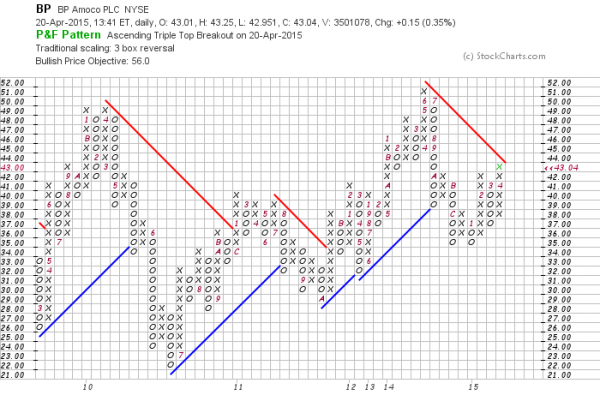
BP Chart

Disclaimer: The information in this blog post represents my own opinions and does not contain a recommendation for any particular security or investment. I or my affiliates may hold positions or other interests in securities mentioned in the Blog, please see my Disclaimer page for my full disclaimer.

3rd party Ad. Not an offer or recommendation by Investing.com. See disclosure here or remove ads .

Original post

Latest comments

Risk Disclosure: Trading in financial instruments and/or cryptocurrencies involves high risks including the risk of losing some, or all, of your investment amount, and may not be suitable for all investors. Prices of cryptocurrencies are extremely volatile and may be affected by external factors such as financial, regulatory or political events. Trading on margin increases the financial risks.
Before deciding to trade in financial instrument or cryptocurrencies you should be fully informed of the risks and costs associated with trading the financial markets, carefully consider your investment objectives, level of experience, and risk appetite, and seek professional advice where needed.
Fusion Media would like to remind you that the data contained in this website is not necessarily real-time nor accurate. The data and prices on the website are not necessarily provided by any market or exchange, but may be provided by market makers, and so prices may not be accurate and may differ from the actual price at any given market, meaning prices are indicative and not appropriate for trading purposes. Fusion Media and any provider of the data contained in this website will not accept liability for any loss or damage as a result of your trading, or your reliance on the information contained within this website.
It is prohibited to use, store, reproduce, display, modify, transmit or distribute the data contained in this website without the explicit prior written permission of Fusion Media and/or the data provider. All intellectual property rights are reserved by the providers and/or the exchange providing the data contained in this website.
Fusion Media may be compensated by the advertisers that appear on the website, based on your interaction with the advertisements or advertisers.
© 2007-2024 - Fusion Media Limited. All Rights Reserved.