Forex News and Events
Russia: Higher oil prices are not enough
The path towards Russian recovery is tortuous. One may think that the higher oil prices was the answer to all of Russia’s problems, it is actually deeper than that. Yet, evidently $50 a barrel is way better for Russia than $30. Obviously, the recent bounce certainly accounts for a significant part of Russia’s expectations to return to growth by next year.
The latest fundamental data is not optimistic. The unemployment rate, released yesterday remains unchanged at 5.2%, while inflation is also on its way down, reading only 4.2% YTD. One area of increasing concerning is retail, with September sales dropping to early 2015 levels at -1.4% m/m. Consumer activity is clearly at risk and this is confirmed by the fact that real disposable income has collapsed to -8.3% y/y.
Inflation is crushing the Russian middle class and this is having a clear, demonstrable impact on retail sales. Other data such as Industrial Production is also on the decline. The increase since last year has ceased and the data is now negative at -0.8% y/y.
The Central Bank’s dual mandate is therefore far from reach and it is going to be difficult for them to further lower the key rate before year-end in an effort to counter inflation upside risks. The next central bank meeting on 28th October should confirm the strategy.
For now, the Central Bank of Russia continues to buy gold to back its currency. We recall that in 2015, Russia bought 208 tons, while adding 172 tons the previous year. For this year, Russia is planning to amass an additional 200 tons.
The medium-term future looks uncertain for Russia and reloading long USD/RUB until the end of this year may be a wise bet.
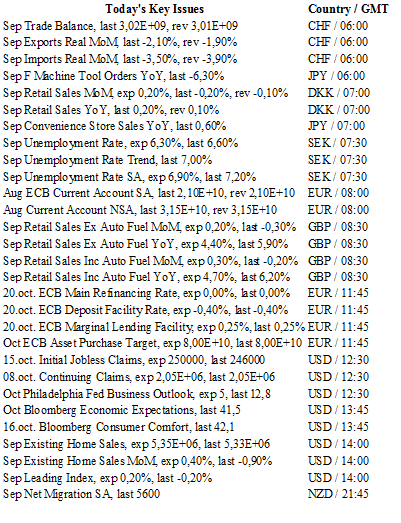
What to expect from today’s ECB meeting?
The ECB’s Quantitative Easing program is due for completion by next March. The massive program has consisted in the purchase of around €1.7 trillion in bonds. Investors are now awaiting the next step to be announced. We believe that no major change will happen at today’s meeting and that policymakers are waiting for more economic data in order to better assess the situation. Instead, we feel that December’s meeting will be the key meeting of this year.
For the time being, the economic fundamentals seem mixed. Eurozone growth has not really picked up. Q2 printed at 0.3% q/q down from Q1. In addition, core inflation rose to two year-highs in September at 0.4% on the month and 0.8% y/y. However, the ECB’s target of 2% still seems far away. We believe that the ECB’s all-in program has avoided a deeper recession but has failed to properly stimulate the economy.
Europe’s situation still looks uncertain. The nightmare promised in the wake of the Brexit did not happen and Italy’s December referendum could trigger additional turmoil for EU cohesion. Currency-wise, there is further room for additional euro weakness which should bring some relief to European exporters.


The Risk Today
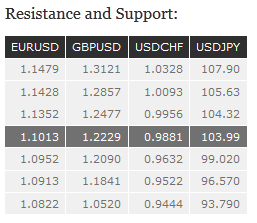
EUR/USD limited rebound indicates selling pressure. Hourly support given at 1.0952 (25/07/2016 low) is on target. Hourly resistance can be found at 1.1058 (13/10/2016 high). Key resistance is located far away at 1.1352 (18/08/2016 high). Further consolidation is favoured. In the longer term, the technical structure favours a very long-term bearish bias as long as resistance at 1.1714 (24/08/2015 high) holds. The pair is trading in range since the start of 2015. Strong support is given at 1.0458 (16/03/2015 low). However, the current technical structure since last December implies a gradual increase.
GBP/USD's sell-off seems to pause for the time being. Hourly resistance at 1.2272 (13/10/2016 high) has been broken. Another resistance is given at 1.2325 (18/10/2016 high). Key resistance stands far away at 1.2620 then 1.2873 (03/10/2016). Expected to show further increase. The long-term technical pattern is even more negative since the Brexit vote has paved the way for further decline. Long-term support given at 1.0520 (01/03/85) represents a decent target. Long-term resistance is given at 1.5018 (24/06/2015) and would indicate a long-term reversal in the negative trend. Yet, it is very unlikely at the moment.
USD/JPY has successfully bounced off 103.17 low. A break of hourly support at 102.81 (10/10/2016 low) is needed to confirm underlying pressures. Key support can be found at 100.09 (27/09/2016). Hourly resistance can be found at 104.64 (13/10/2016 higher). Expected to further decline. We favor a long-term bearish bias. Support is now given at 96.57 (10/08/2013 low). A gradual rise towards the major resistance at 135.15 (01/02/2002 high) seems absolutely unlikely. Expected to decline further support at 93.79 (13/06/2013 low).
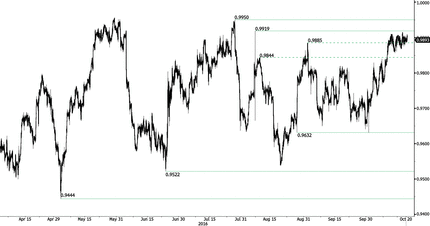
USD/CHF is testing resistance area between 0.9919 (07/08/2016 low) and 0.9950 (27/07/2016). The pair remains on a bullish momentum since September 15. Hourly support is be located at 0.9733 (05/10/2016 base) then 0.9632 (26/08/2016 base low). Expected to see continued increase. In the long-term, the pair is still trading in range since 2011 despite some turmoil when the SNB unpegged the CHF. Key support can be found 0.8986 (30/01/2015 low). The technical structure favours nonetheless a long term bullish bias since the unpeg in January 2015.

