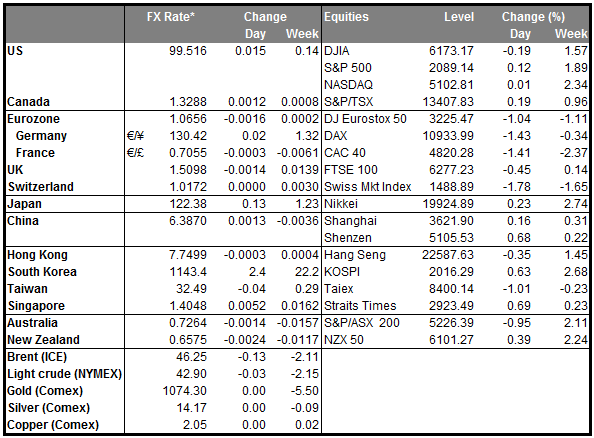
• Markets await Yellen’s testimony Fed Chair Janet Yellen will take center stage today, as she delivers the semi-annual Humphrey-Hawkins testimony on monetary policy before Congress. She will repeat the testimony to the Senate the following day. Yellen’s comments will be closely monitored for fresh guidance on the Fed’s near-term plans. A lot has changed since the Fed raised rates in December, with renewed uncertainty about the global economic outlook and unrest in financial market. Earlier last week, Fed officials Fischer and Dudley stated that the FOMC will consider the impact of international developments on the US economy before deciding on interest rates. Based on these comments, the market scaled back its expectations for a March action. We believe that Fed Chair will acknowledge increased risks from abroad, but we also believe that she will sound confident on the domestic economy in order to leave the option for further hikes this year on the table. She could emphasize the positives of the US economy, especially the continuous strength in the job market. Although she will try to keep a balanced stance, we believe that she may be backed into a corner in the QnA session in order to give further hints on whether March is still in play. Any comments that wipe out the surviving hopes for a March hike could bring the greenback under further selling interest.
• Yen strength persists as Nikkei extends losses The Nikkei extended yesterday’s losses, and declined further amid concerns over the solvency of European banks and the stability of the global banking sector. The carnage in equities has led to increased demand for the Japanese currency, which held on to its recent gains to trade near 114 against its US counterpart. If we see the yen’s strength persist given this risk-off environment, the BoJ and government officials could come under increased pressure to depreciate the currency, as it could weaken the inflation outlook and the competitiveness of the Japanese firms. We expect this to happen through verbal interaction rather than currency intervention or policy changes, at least initially. If so, we could see JPY losing some of its recent steam, but should the global risk aversion persist the demand for the safe-haven asset should remain intact.
• As for today’s indicators, in Norway, the CPI rate for January is expected to have hit the Norges Bank target of 2.5% yoy from 2.3% yoy previously. Norway’s inflation remains higher than other European or major economies, while the rise in prices is attributed to the weakness in NOK during last year. Even though the krone entered 2016 on a strong note, the effects of last year’s tumble could continue to drive inflation higher in the next few months. A possible rise in the nation’s inflation rate could strengthen the krone, at least at the release.
• From the UK, we get the industrial production for December and expectations are for the figure to have fallen again, but at a slower pace than in the previous month. This will be an additional piece of information on how the British economy performed in Q4. In its calculation for the nation’s 1st estimate of Q4 GDP, the ONS reported that IP declined 0.2% mom in December, although the overall output had accelerated somewhat. A more-than-expected decline in today’s figure could raise some concerns for a downside revision in the 2nd estimate of GDP, which comes out on the 25th of the month.
• Besides Fed Chair Yellen we have two more speakers on the agenda: San Francisco Fed President John Williams and ECB Executive Board member Peter Praet.
The Market
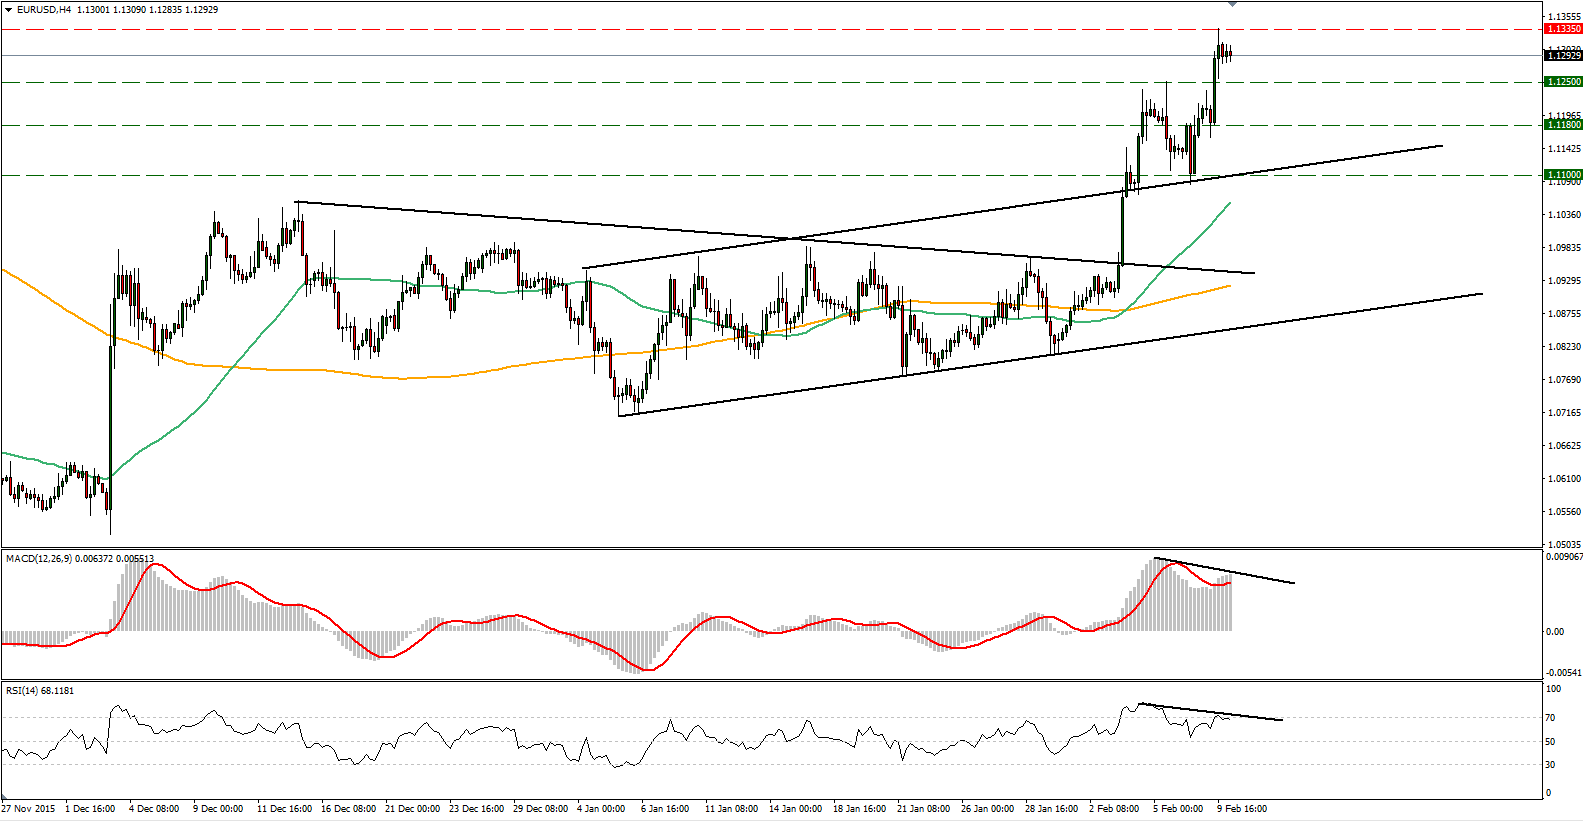
EUR/USD hits resistance near 1.1335
• EUR/USD surged on Tuesday to find resistance near the 1.1335 (R1) area. Following the break on the 3rd of February above the 1.0985 hurdle, which is the upper bound of the sideways range it had been trading since December, the short-term outlook has turned to positive, in my view. A decisive move above 1.1335 (R1) would confirm a forthcoming higher high on the 4-hour chart and could open the way for the next resistance zone of 1.1385 (R2). Looking at our short-term oscillators though, I see the possibility that another setback could be looming before the bulls decide to seize control again. The RSI turned down after it hit resistance at its downside resistance line near 70, while the MACD, although positive, shows signs of topping and could fall below its trigger line. I also detect negative divergence between our oscillators and the price action that supports the case for a pullback. As for the bigger picture, as long as the rate is trading between the 1.0800 key zone and the psychological area of 1.1500, I would keep the view that the medium-term outlook stays flat.
• Support: 1.1250 (S1), 1.1180 (S1), 1.1100 (S3)
• Resistance: 1.1335 (R1), 1.1385 (R2), 1.1485 (R3)
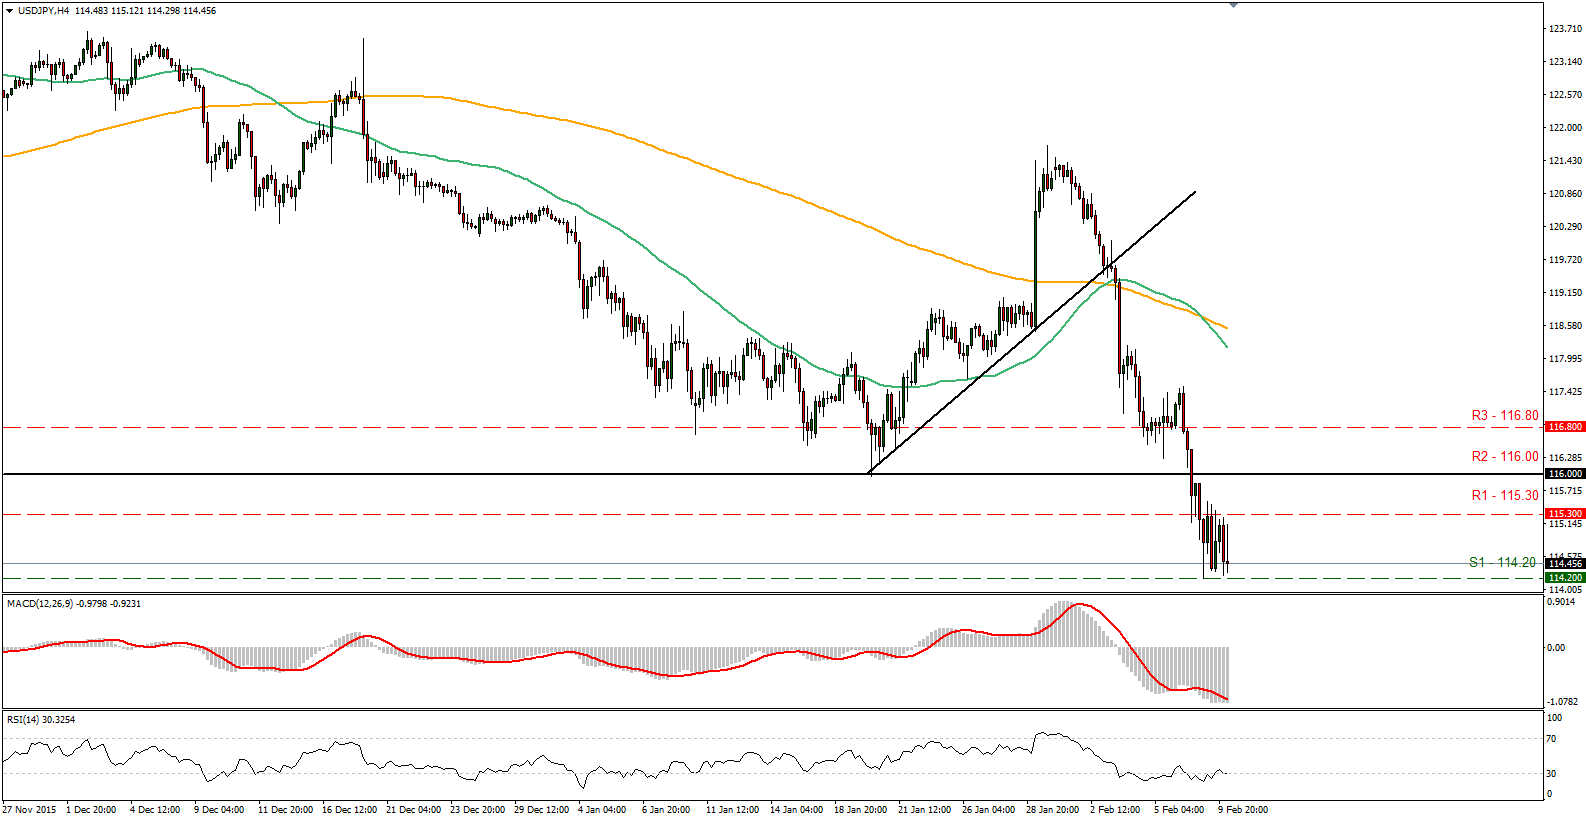
USD/JPY hovers just above 114.00
• USD/JPY consolidated on Tuesday remaining locked above the 114.20 (S1) support area and the 115.30 (R1) resistance barrier. Today, during the Asian morning, the pair stayed elevated just above the 114.20 (S1) support line. The price structure on the 4-hour chart still suggests a downtrend and as a result, I would expect a dip below 114.20 (S1) to initially target our next hurdle of 113.90 (S2) marked by the low of the 10th of November 2014. Our short-term oscillators reveal strong downside speed and corroborate my view that USD/JPY is poised to continue lower. The RSI stands below its 30 line and points down, while the MACD lies below both its zero and trigger lines, and is pointing south as well. As for the bigger picture, I believe that the close below 116.00 (R2) has turned the longer-term outlook negative as well and could open the way for larger bearish extensions.
• Support: 114.20 (S1), 113.90 (S2), 113.20 (S3)
• Resistance: 115.30 (R1), 116.00 (R2), 116.80 (R3)
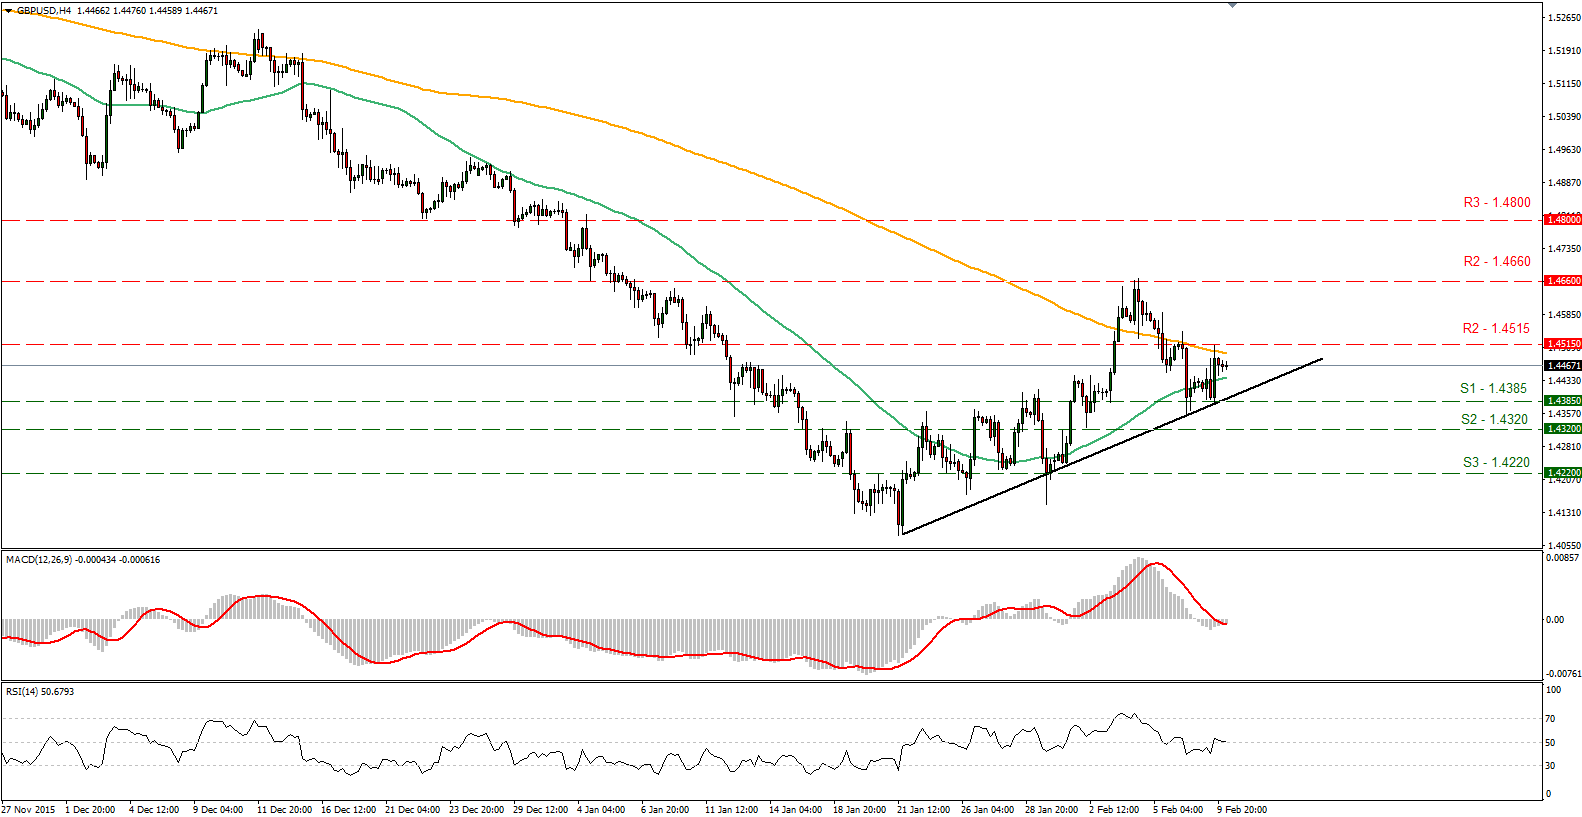
GBP/USD slightly higher after hitting support at 1.4385
• GBP/USD traded slightly higher on Tuesday after it hit support at the crossroad of the upside black line and the 1.4385 (S1) zone. Given that the rate is still trading above that uptrend support line, I would consider the near-term outlook to stay positive. A break above 1.4515 (R1) could challenge again our next resistance at 1.4660 (R2). Taking a look at our short-term momentum studies, I see evidence that yesterday’s advance may continue, perhaps to test the 1.4515 (R1) level. The RSI crossed above its 50 line and is pointing up, while the MACD has crossed above its trigger line and seems willing to enter the positive territory. In the bigger picture, the price structure remains lower peaks and lower troughs below the 80-day exponential moving average, which is pointing down. Thus, I still see a negative longer-term picture and I would treat the recovery started on the 21st of January, or any possible extensions of it, as a corrective phase for now.
• Support: 1.4385 (S1), 1.4320 (S2), 1.4220 (S3)
• Resistance: 1.4515 (R1), 1.4660 (R2), 1.4800 (R3)
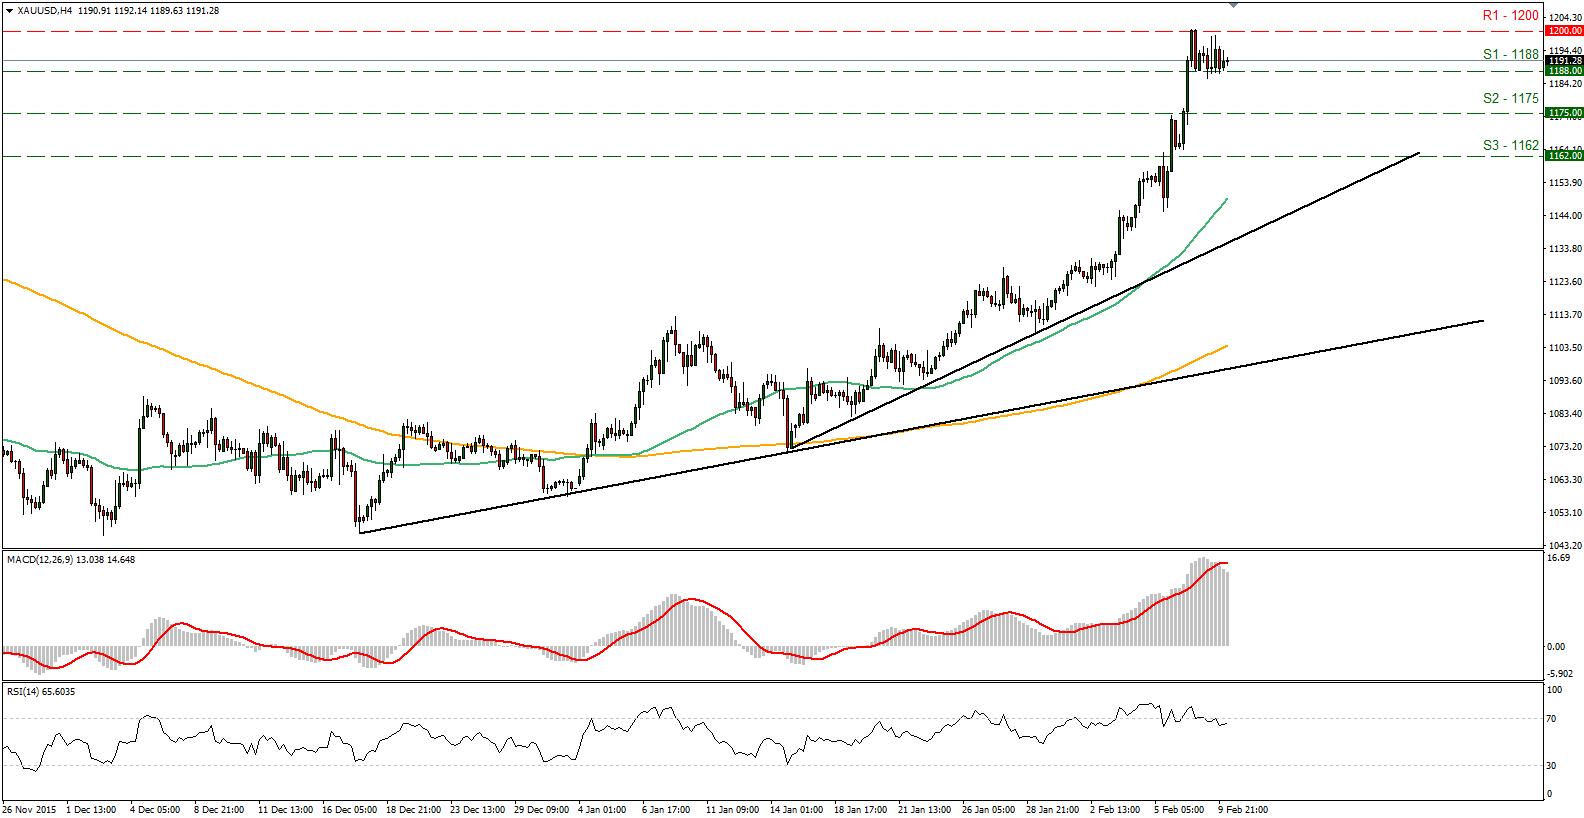
Gold near the psychological zone of 1200
• Gold traded in a sideways range on Tuesday, staying within the psychological zone of 1200 (R1) and the 1188 (S1) support line. The price structure on the 4-hour chart still suggests an uptrend and therefore, I would expect a clear move above the 1200 (R1) zone to target our next resistance of 1215. (R2). However, taking a look at our short-term oscillators, I see the likelihood that a setback could be looming before the next positive leg. The RSI fell back below its 70 line, while the MACD, at extreme positive levels, has topped and crossed below its trigger line. Switching to the daily chart, I see that on the 4th of February, the price broke above the long-term downside resistance line taken from the peak of the 22nd of January 2015 and as a result, I would consider the medium-term outlook to be positive as well. On the weekly chart however, the precious metal is near the longer-term downside resistance line taken from August 2013. I would need a clear break above that line to trust larger bullish extensions.
• Support: 1188 (S1), 1175 (S2), 1162 (S3)
• Resistance: 1200 (R1), 1215 (R2), 1230 (R3)
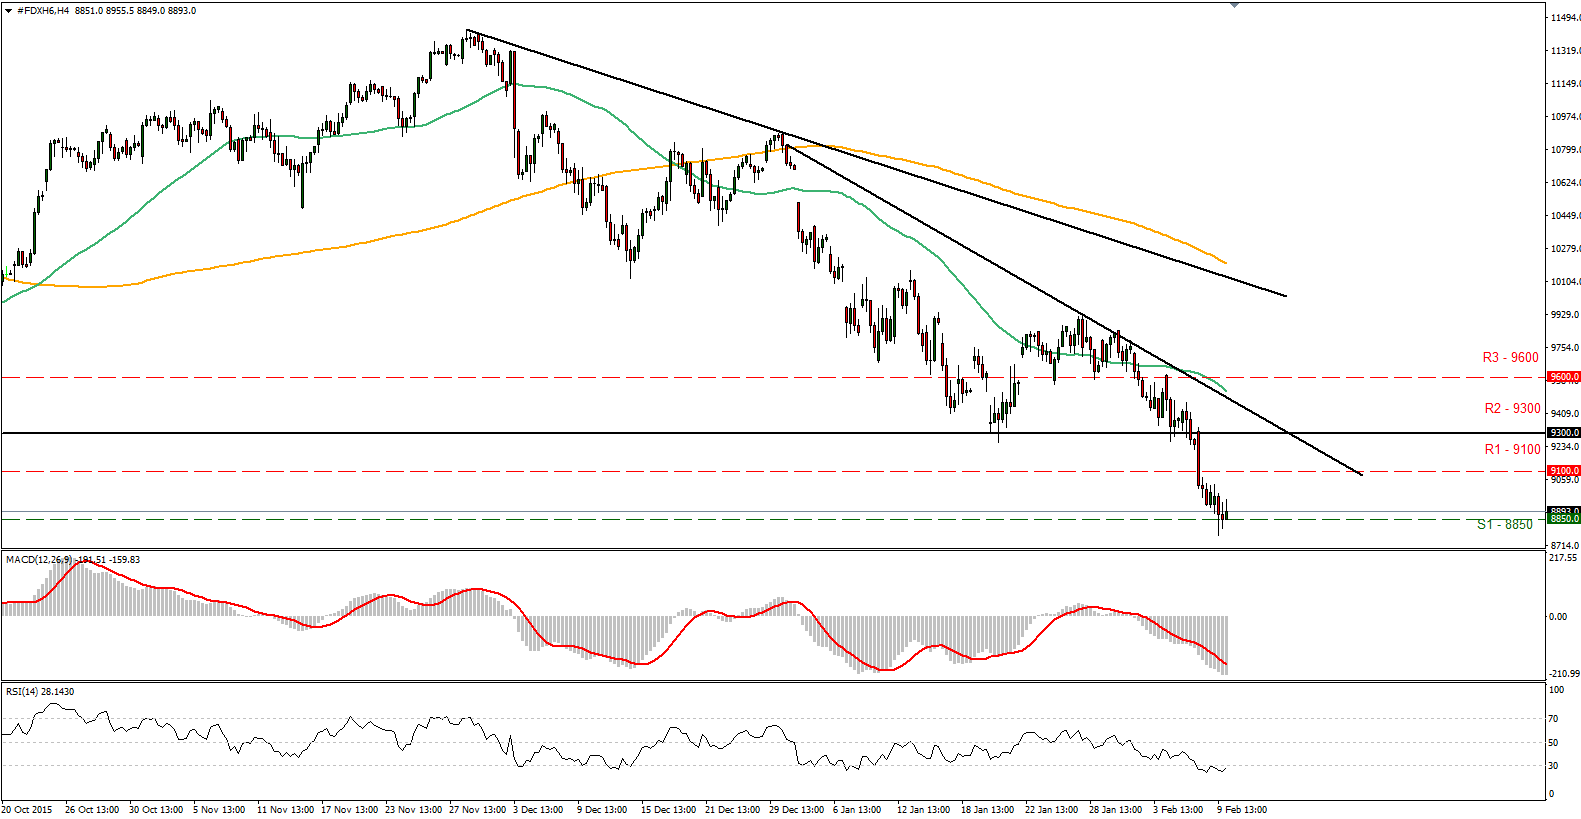
DAX futures near 8850
• DAX futures fell further on Tuesday, after falling and closing on Monday below the key support (now turned into resistance) zone of 9300 (R2). This was the first daily close below that hurdle since November 2014. The decline was halted by the 8850 (S1) support zone and during the early European morning Wednesday, the index trades in a consolidative manner slightly above that barrier. The price structure on the 4-hour chart still suggests a short-term downtrend and therefore, I would expect a clear break below 8850 (S1) to see scope for extensions towards our next support zone of 8650 (S2), defined by the low of the 21st of October 2014. Our short-term oscillators detect accelerating downside speed and magnify the case for the index to continue trading lower. The RSI, already within its oversold territory, hit the 30 line and turned down, while the MACD stands below both its zero and trigger lines, and points south as well.
• Support: 8850 (S1), 8650 (S2), 8360 (S3)
• Resistance: 9100 (R1), 9300 (R2), 9600 (R3)

