Currencies
EUR/USD – continued to climb higher as the data out of Germany yesterday was better than expected and we are seeing a general weakening of the USD since yesterday.
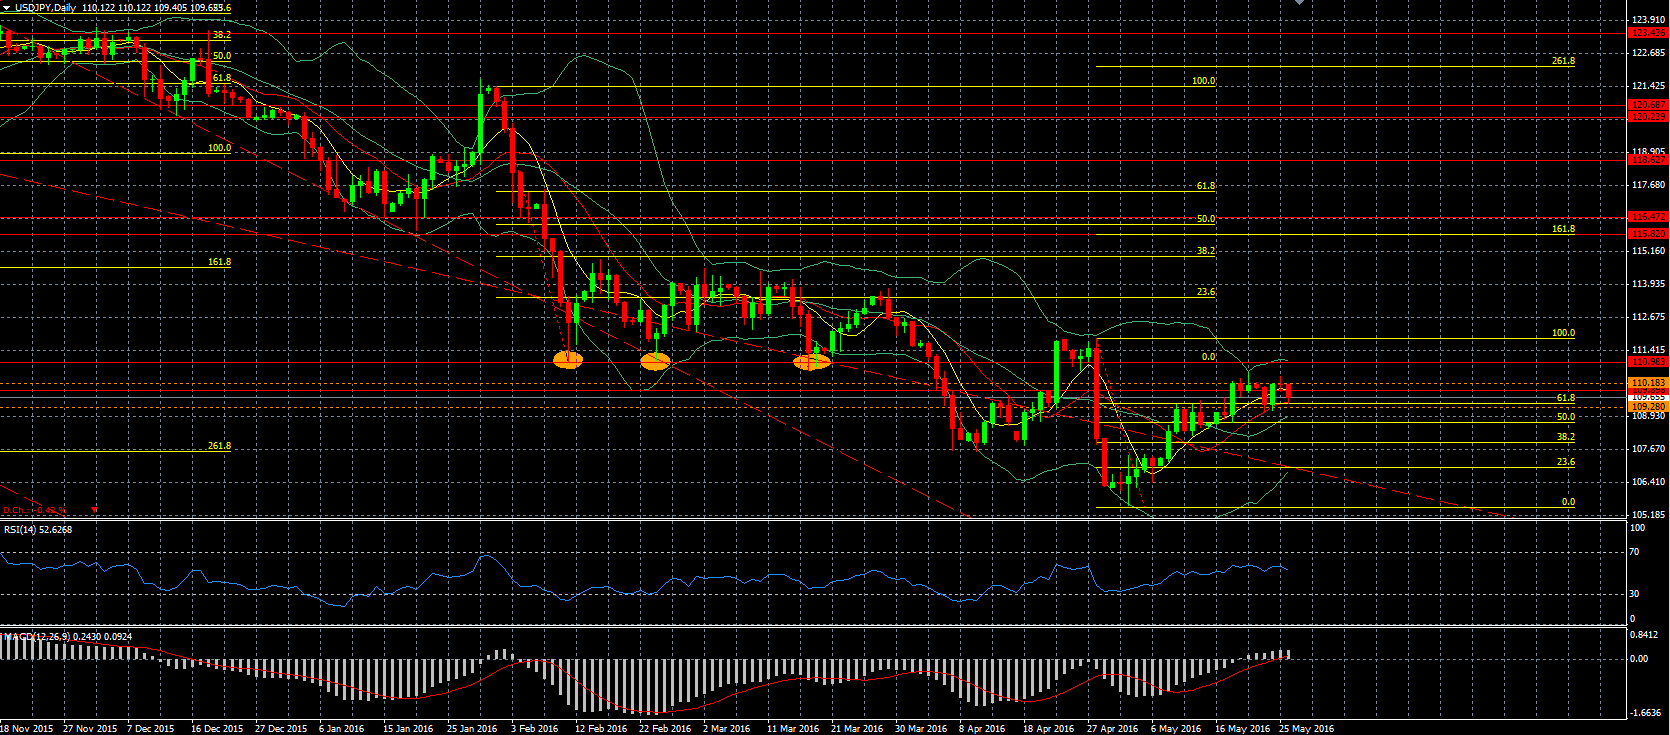
USD/JPY – is moving down again as the USD is losing some of its recent strength and also amid uncertainty what will happen with the planned sales tax hike in Japan. Technically we can see that the levels mentioned yesterday are still in place and we could see a test of the lower support today.
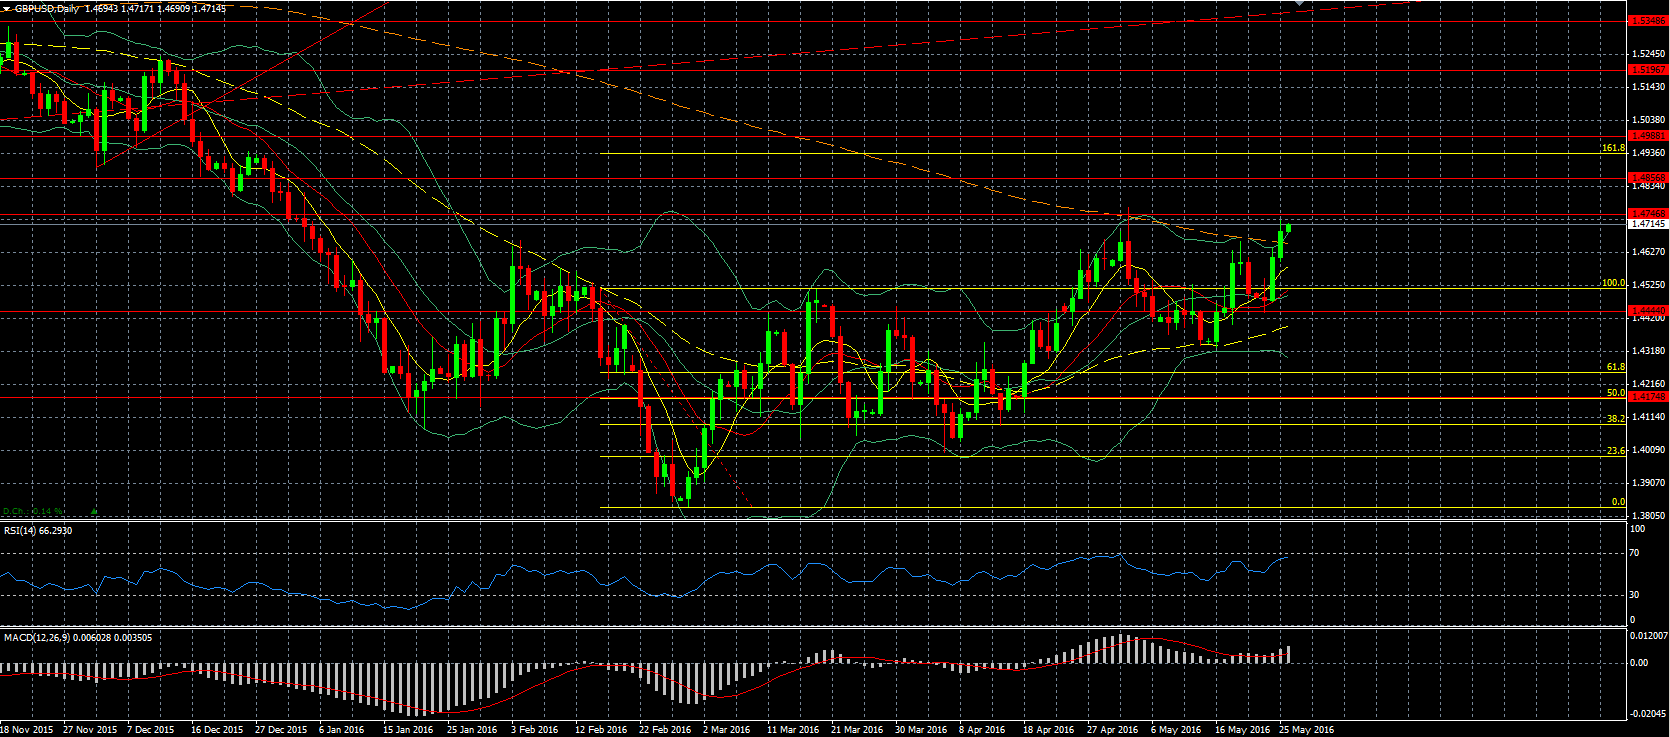
GBP/USD – it looks like there is not stopping the GBP, but if there is we could see so today as we get the GDP data out of the UK this morning. In addition we are nearing the resistance around the 1.475 level.
USD/CAD – moved lower as the USD weakened and the CAD strengthened due to the higher oil price. The BOC kept the interest rate unchanged as expected, and also said that the fires that have been plaguing Canada will have an impact this quarter, but that it expects that next quarter it will recover.
Indices
S&P 500 – continued to climb and is getting closer to the resistance around the 2100 level.
Commodities
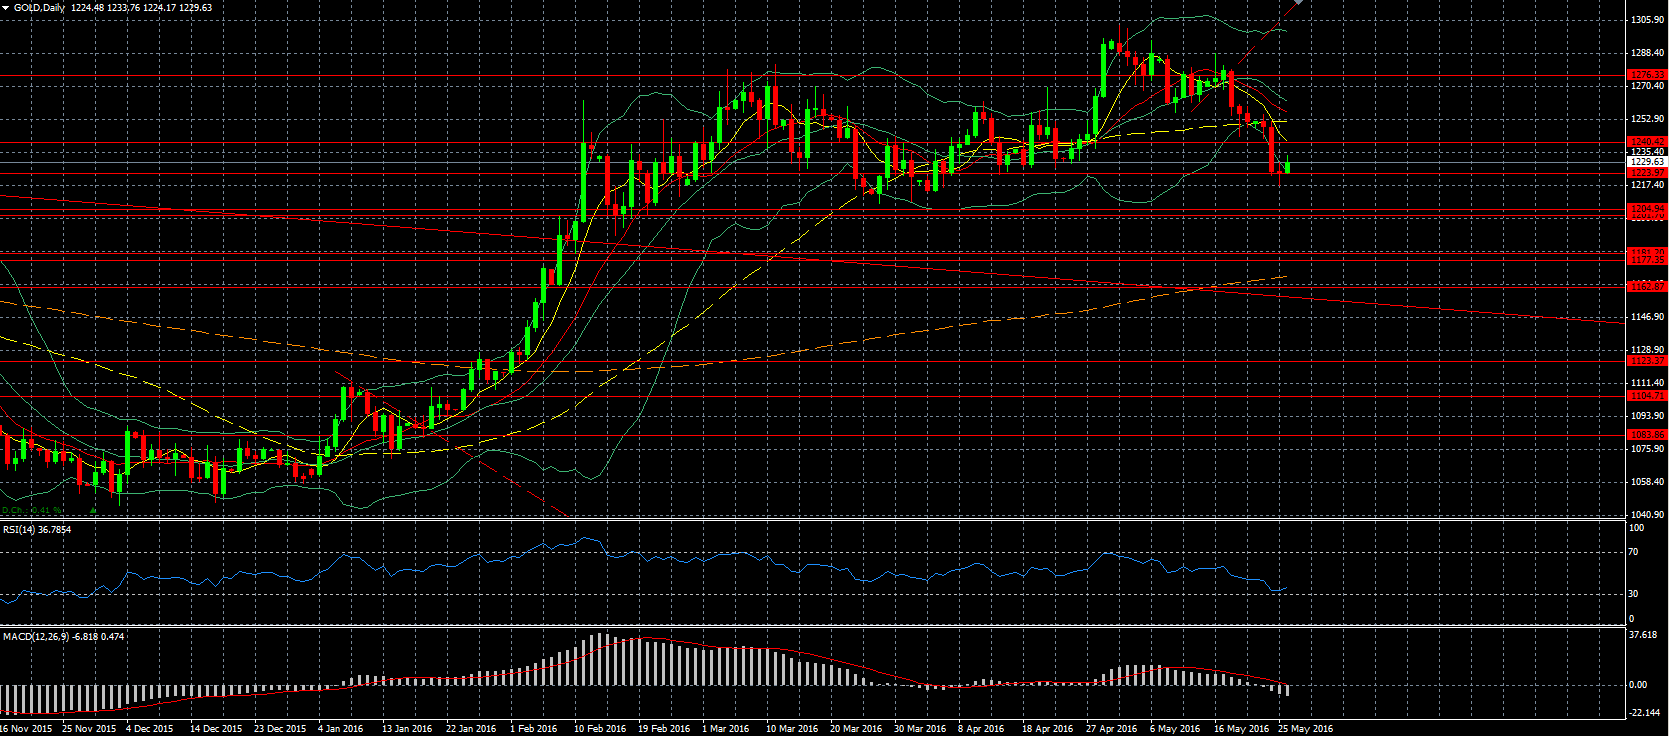
Gold – even though it was trading below the support around the 1224 level, we can see it managed to close exactly around that level and has since moved up. We can see the USD weakening, also with some weaker data out of the US yesterday. However the most important piece of data will be the GDP data on Friday.
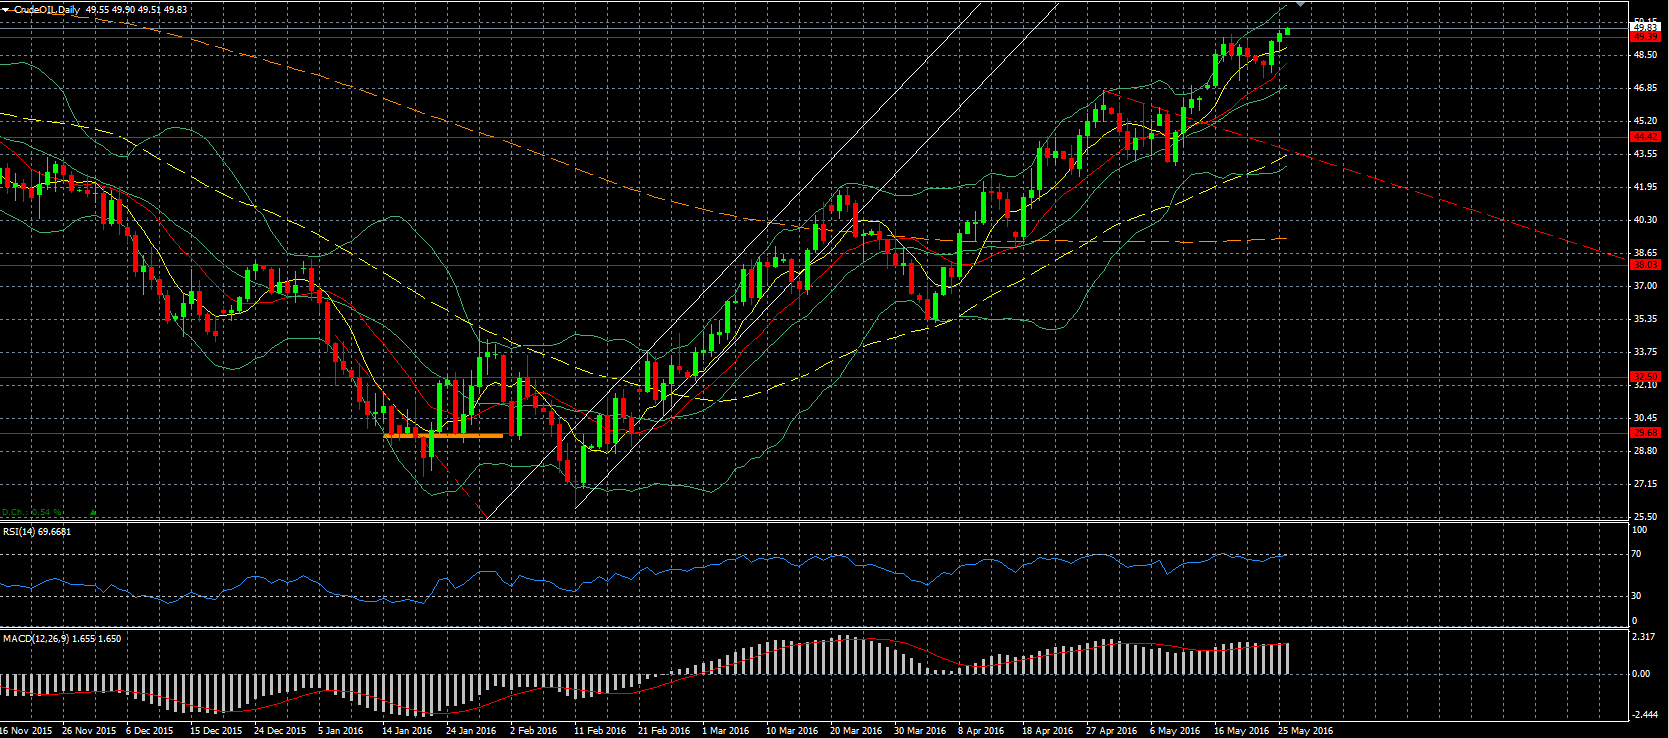
Oil – moved up and after apparently breaking through the resistance it is now attempting to break through the psychological level of 50. It is possible that at these levels we will see some profit taking. The inventories showed a larger decline than expected and also production continued to decline. Focus will now start to shift towards the OPEC meeting of next week.
Stocks
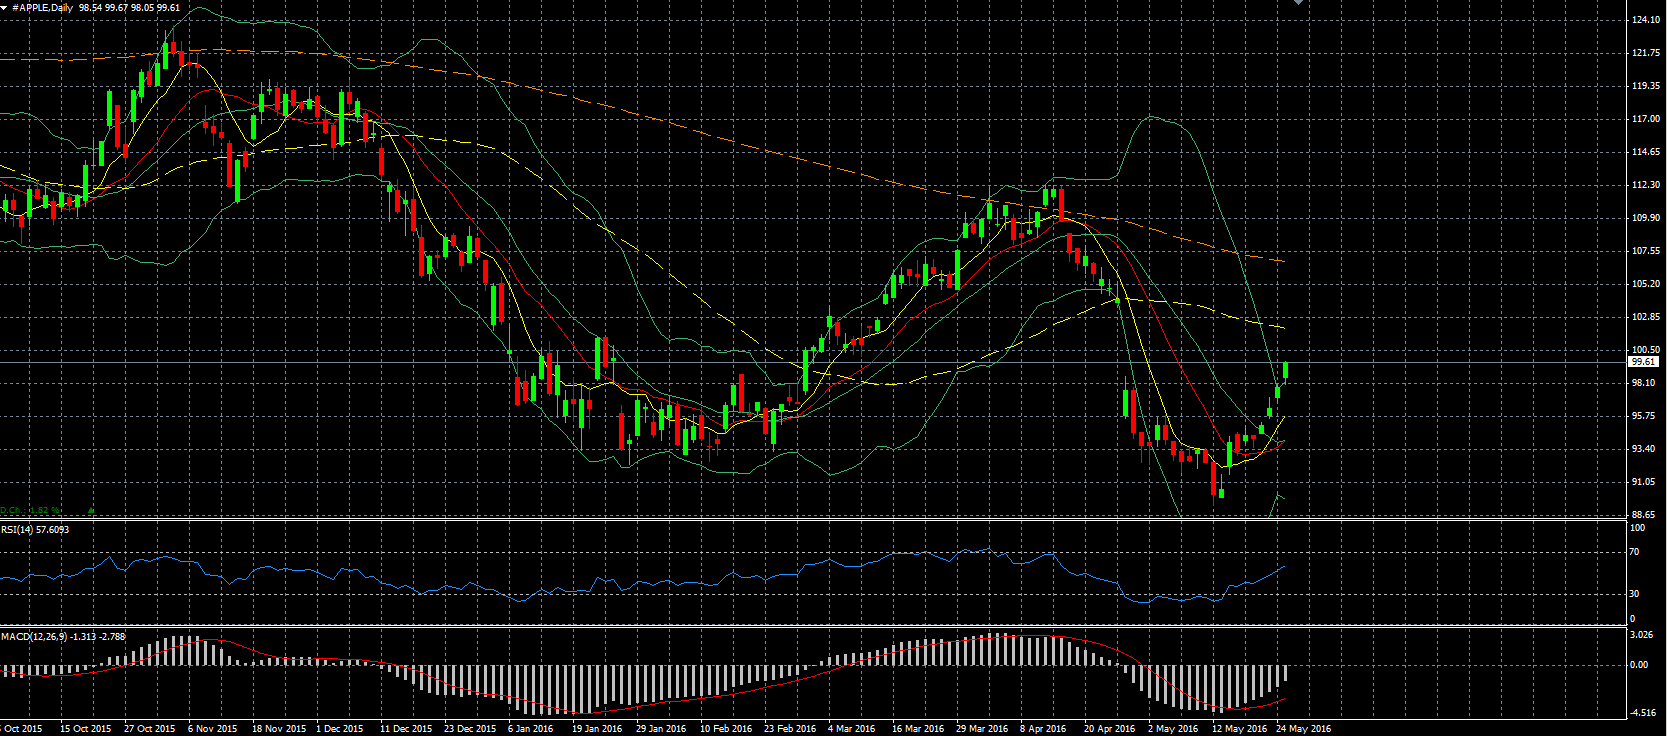
Apple (NASDAQ:AAPL) – has been moving up since Berkshire Hathaway (NYSE:BRKa) announced its stake in the company and also because of the reports that Apple expects a lot of demand for the iPhone 7 once it is released. We are close to crossing the 100 mark again, and the first target will be to close the gap just below the 104 level.
AT&T (NYSE:T) & Yahoo (NASDAQ:YHOO) – AT&T is reportedly also interested in taking over Yahoo’s internet business and has made an offer.
Microsoft (NASDAQ:MSFT) – is more or less giving up on the smart phone industry as it is cutting up to 1,850 jobs in that department. Microsoft was unable to become a major player in the field, also not after having taken over Nokia (HE:NOKIA) a few years ago.
Royal Dutch Shell (LON:RDSa) – announced it is cutting another 2,200 jobs as it is still having a hard time with the low oil price, even though it is on the way back up.
By Shawn Koopman
