
Market Snapshot:

INDICES: Indices are an excellent barometer of risk, so to see them sell-off across Europe, WE and Asia should be a clear signal that the markets are a little risk averse at late.
COMMODITIES: Gold has broken up through an important resistance level and continues to look technically strong. Only a stringer equity market and higher bond yields are likely to threaten this underlying bullish trend.
EUR: Draghi suggested a move, other than quantities easing, to fend off deflation within the Eurozone by buying bank loan packages of households and companies.
GBP: The British Pound sold off last week and suggests further losses ahead. However whilst several Bearish Engulfing candles have appeared on the weekly chart this raises possibility of near-term gains early this week for intraday setups.
USD: The USD Index closed the week back below 80.50 to produce Dark Cloud cover reversal pattern. However this is within a messy complex correction so not considered to be a reliable reversal pattern.
Technicals:
USD/CHF: Bias remains 0.90
After eventful Friday's the markets on Monday do have a tendency to be jittery and retrace against themselves. The other outcome is of course we see a resumption of the moves on Friday - but this is less often and is purely down to the importance of the events which caused the moves in the first place.
I favour the bullish retracement of the USD, however this hinges on the VIX reversing (lower) and US Treasuries holding above support levels.
The very least encourage a mini bullish run. Take into account we have again respected the broken trendline and produced a long-tail candle above this level (to show buying down at these levels) it provides me with extra confidence we may retrace towards 0.90. As always it is a question of how it will get there, if at all. If history has anything to go by price action could be messy today, so short-term trading would remain the preference until we see clearer directional trading.
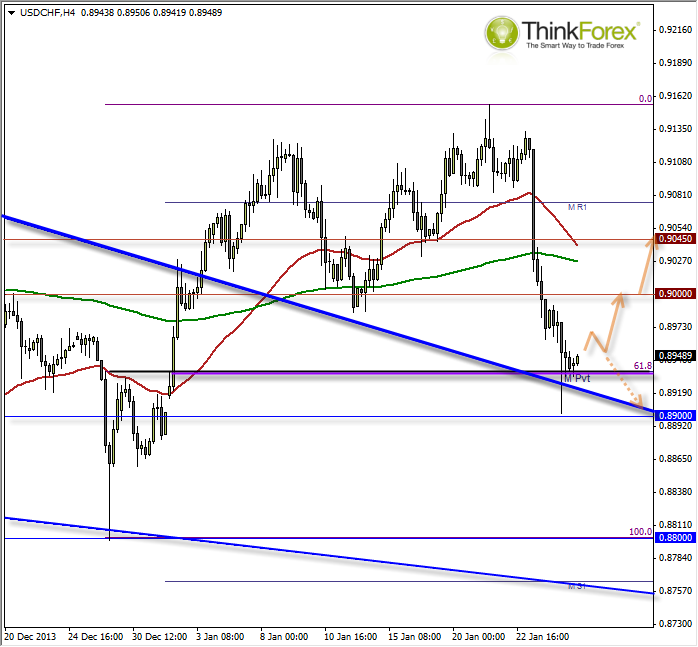 USD/CHF Hourly Chart" title="USD/CHF Hourly Chart" width="474" height="242">
AUD/USD:
On the bullish argument we have broken a bearish trendline and formed a suspected double bottom. I correct the double bottom would project a target around 0.8780 where we see the resistance confluence comprising of Monthly S1 and Daily Pivot.
On the bearish asgument we are trading beneath the 50-eMA and Weekly PIvot. There is also the possibility we have witnessed the end of an 'ABC' correction which would then assume a resumption of the bearish movement.
In the event Bond Yields hold above support and equities rise then this favours the bearish argument and for a resumption of the bearish trend. The next bearish target would be 0.8860 and 0.8625. 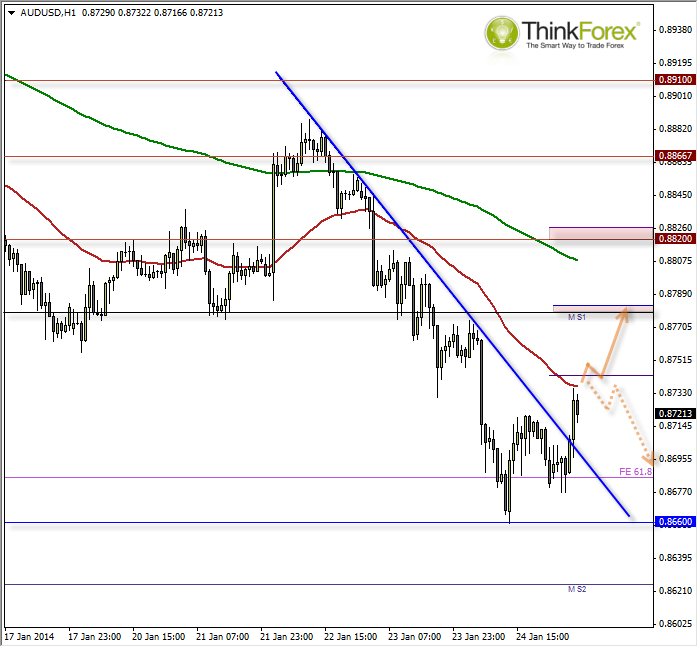 AUD/USD Hour Chart" title="AUD/USD Hour Chart" width="474" height="242">