Upcoming US Events for Today:
- Factory Orders for December will be released at 10:00am. The market expects a month-over-month decline of 1.8% versus an increase of 1.8% previous.
Upcoming International Events for Today:
- Great Britain PMI Construction for January will be released at 4:30am EST.
- Euro-Zone Producer Price Index for December will be released at 5:00am EST.
Recap of Yesterday’s Economic Events:
| Event | Actual | Forecast | Previous |
| AUD AiG Performance of Manufacturing Index | 46.7 | 47.6 | |
| CNY Non-manufacturing PMI | 53.4 | 54.6 | |
| EUR Italian Purchasing Manager Index Manufacturing | 53.1 | 53.2 | 53.3 |
| EUR French Purchasing Manager Index Manufacturing | 49.3 | 48.8 | 48.8 |
| EUR German Purchasing Manager Index Manufacturing | 56.5 | 56.3 | 56.3 |
| EUR Euro-Zone Purchasing Manager Index Manufacturing | 54 | 53.9 | 53.9 |
| GBP Purchasing Manager Index Manufacturing | 56.7 | 57.3 | 57.2 |
| CAD Industrial Product Price (MoM) | 0.70% | 0.30% | 0.20% |
| CAD Raw Materials Price Index (MoM) | 1.90% | 2.00% | -4.20% |
| USD Markit US PMI Final | 53.7 | 53.9 | 53.7 |
| USD ISM Manufacturing | 51.3 | 56 | 56.5 |
| USD Construction Spending (MoM) | 0.10% | 0.00% | 0.80% |
| USD ISM Prices Paid | 60.5 | 54 | 53.5 |
The Markets
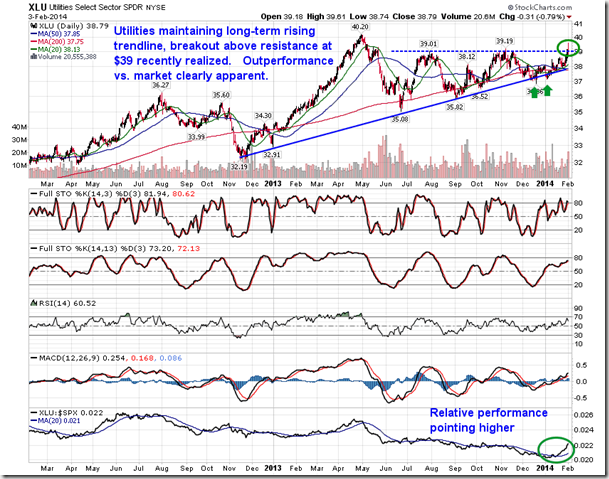
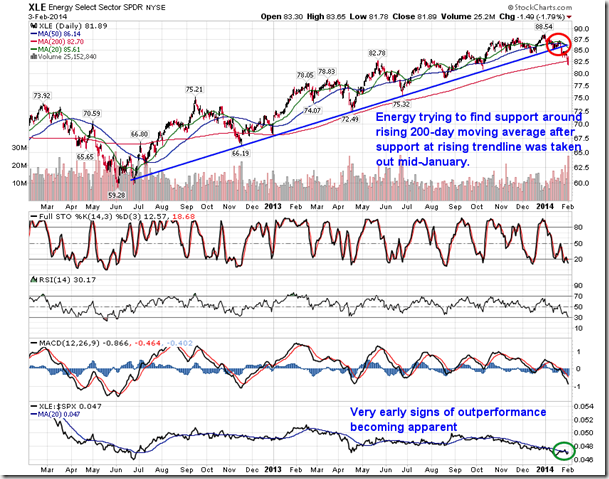
Stocks traded substantially lower on Monday, starting the month with one of the first day returns for the month of February since 1933. Losses escalated following a weaker than expected report pertaining to Manufacturing as the impact of inclement weather in the month of January shows signs of taking a toll on economic activity. The ISM Manufacturing index reported a 51.3, missing estimates calling for 56. The indicator continues to suggest expansion, albeit well off of the pace of 56.5 recorded in December; 50 marks the dividing line between expansion and contraction. We alluded to the impact that weather has on equity markets the other day. Since 1980, returns for the S&P 500 Index during the 7 coldest winters (approximately from December 21st to March 21st) in New York averaged 1.00%, well below the average return for all years of 3.22%. Average returns match that of an average year when temperatures are closer to normal. During the 7 warmest winters, the S&P 500 index averaged a gain of 6.90%, well above the average return for any given year. When temperatures sink to extreme lows, all sectors of the market tend to produce returns below that of an average year, except for two: energy and utilities. Returns for the energy sector during colder than normal years average a gain of 3.84%, while returns for the utilities sector average a loss of 0.34%; both sectors typically see returns for the winter season average 2.93% and –1.03%, respectively. The utilities sector (XLU) has already shown outperformance versus the market since the year began, producing a return of 2.5% since the winter season began, one of the few sectors to have maintained a positive result over the period. The energy sector, on the other hand, has so far failed to show a positive result, declining 5.52% since the winter season began as cyclical sectors show significant weakness. Relative performance of the energy sector (XLE) is showing early signs of improvement, declining less than the market, including during Monday’s significantly negative session, suggesting that demand to hold the assets in this market segment is increasing, at least compared to other equity market sectors. The energy sector remains in a period of seasonal strength through to May, benefitting from stronger energy commodity prices, such as oil.
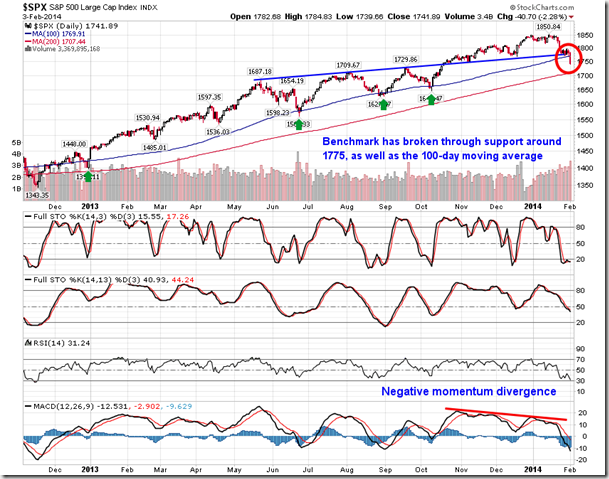
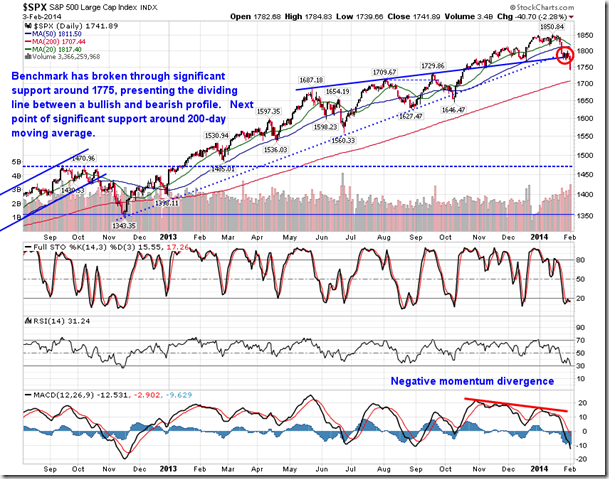
Equity market activity during Monday’s session was nothing less than damaging. Support at 1775 for the S&P 500 was easily broken, fulfilling the the bear-flag highlighted in the last stock market outlook report. The 100-day moving average, a key level that has supported the long-term trend since 2012, was also broken. The short-term trend of higher-highs and higher-lows has been broken with the break below 1768. The 200-day moving average, around 1707, is the next level to watch to support the long-term trend.
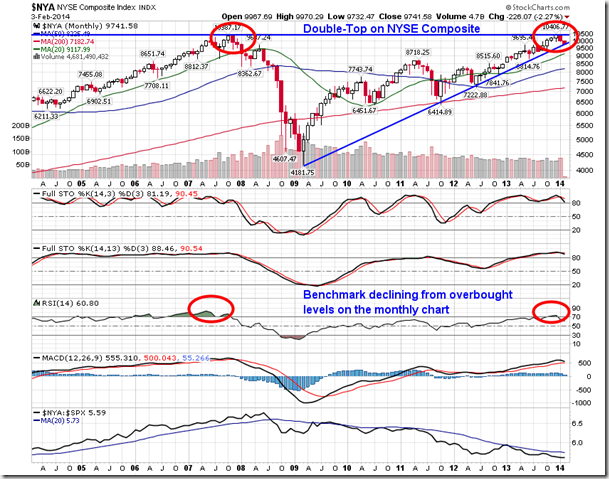
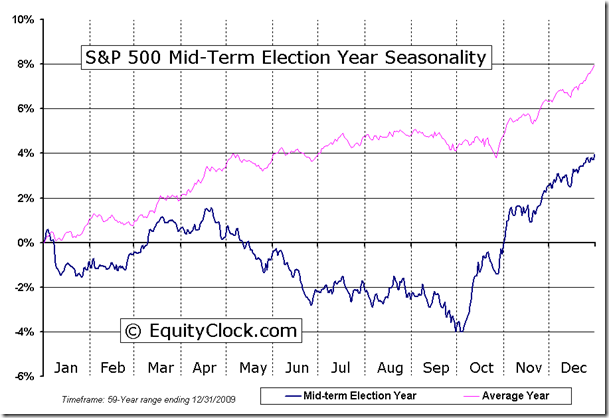
The NYSE Composite is showing evidence of a double top as the benchmark tests resistance charted around the 2007 peak; constituents of this benchmark continue to struggle to regain losses from the recession. The benchmark is rolling over from overbought levels on the monthly chart, similar to the activity that was realized prior to the recession downturn. The broad market benchmark had recently become significantly stretched above major monthly moving averages, including the 20-month, which currently sits at 9118, or around 6.5% below Monday’s close. The 20-month moving average has historically provided support to the long-term trend, including from 2004 through 2007. The 20, 50, and 200-month moving averages continue to point higher suggesting positive trends on an ultra-long-term scale. Although a correction of 10% or more is becoming increasingly likely across the major benchmarks, short and intermediate-term weakness continues to offer ideal entry opportunities for the long-term trend. Weaker than average returns during mid-term election years persist through to October, at which time strong gains through the last quarter of the year are common.
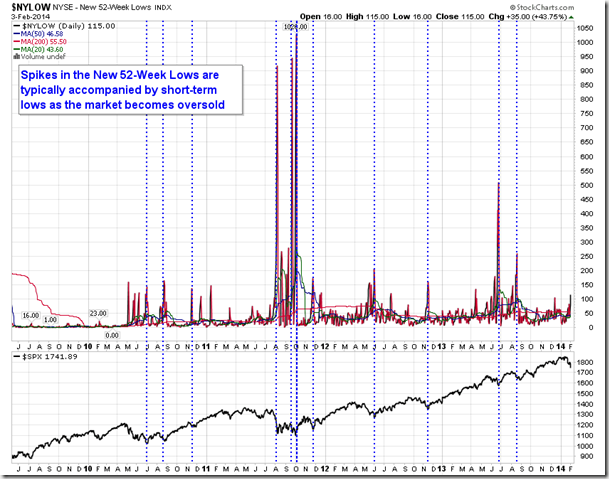
One indicator to watch to determine if a tradable low has been established is the number of stocks charting 52-week lows. The number of stocks on the NYSE charting new 52-week lows has increased from close to zero at the start of the year to 115 as of Monday’s close. Still, the increase pales in comparison to spikes over the last few years from which short-term tradable lows have developed. A reading of 150 or more begins to suggest that stocks are overly stretched to the downside and close to having exhausted significant market declines. We’re not there yet, but certainly are getting close as losses accelerate. A broad range of stocks had recently charted new 52-week highs, regardless of what individual fundamentals had to say. This was unsustainable. As can be seen on the chart below, these periods of weakness have occurred fairly regularly throughout the years, the last occurring in August of last year; clearly another period of reset was due. General rule is that when the number of 52-week lows stops going higher, equity markets will stop going lower.
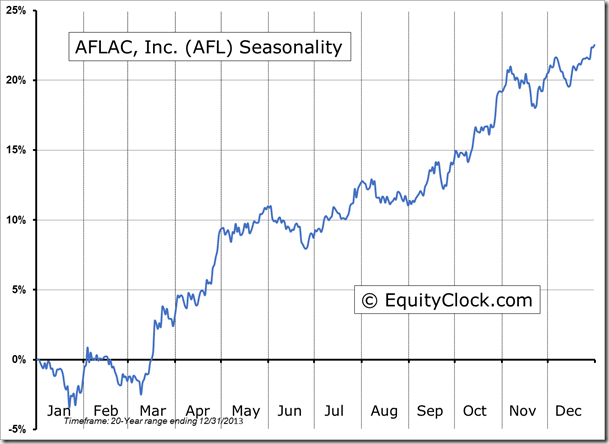
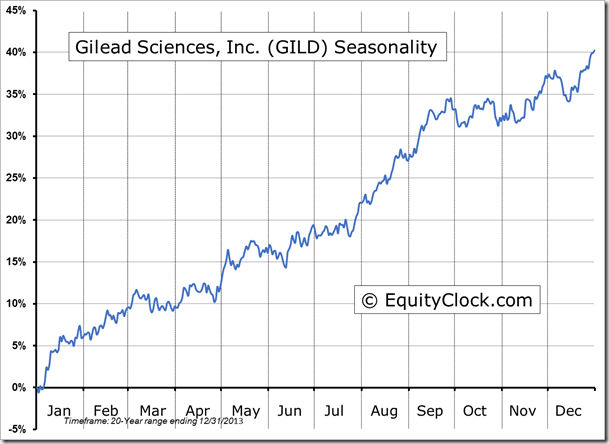
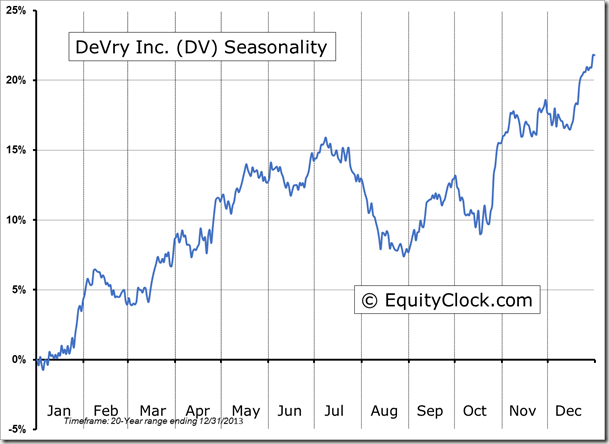
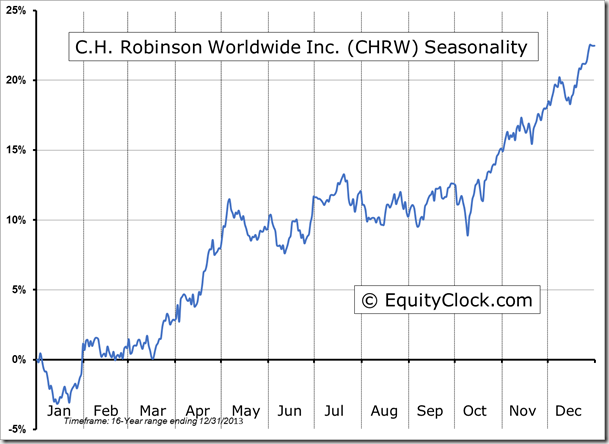
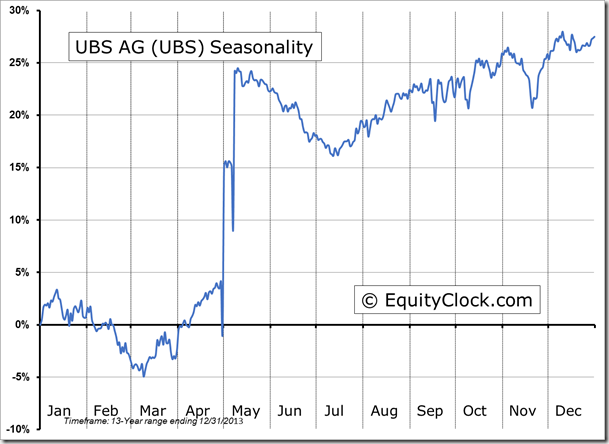
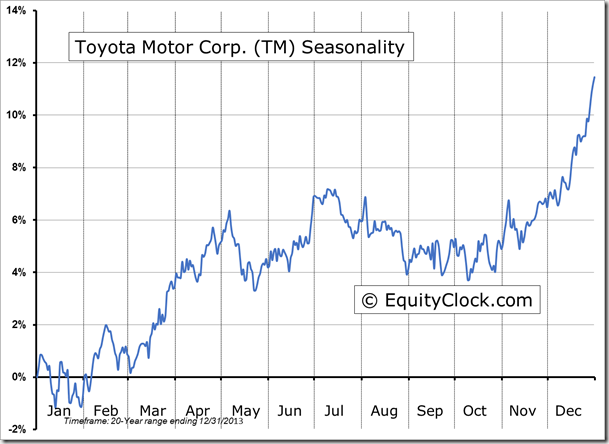
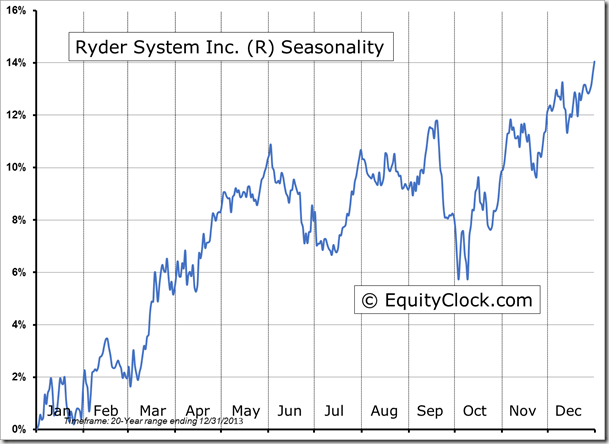
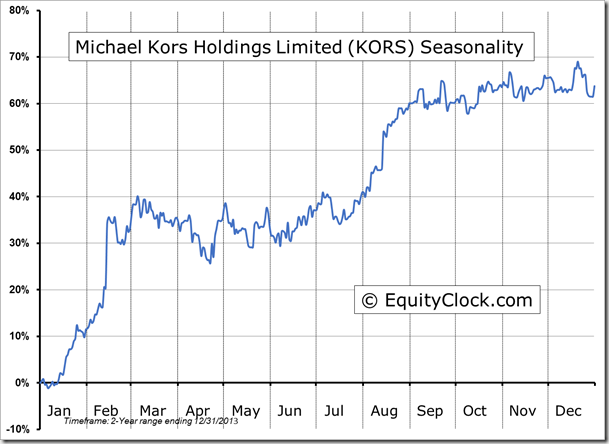
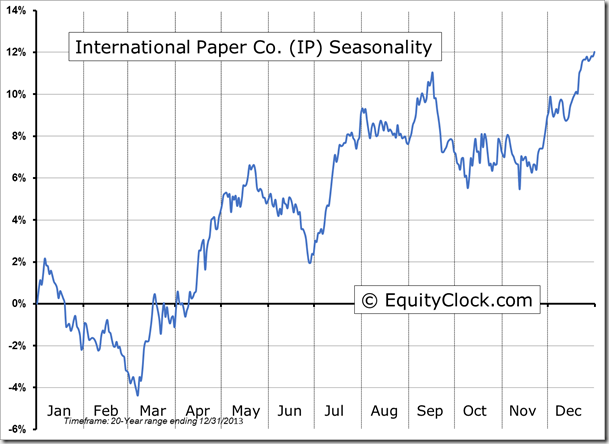
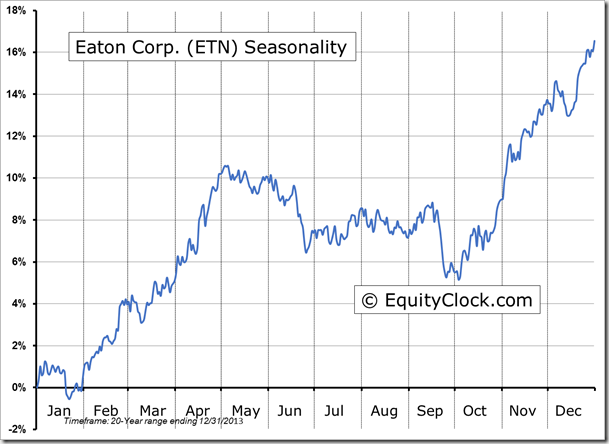
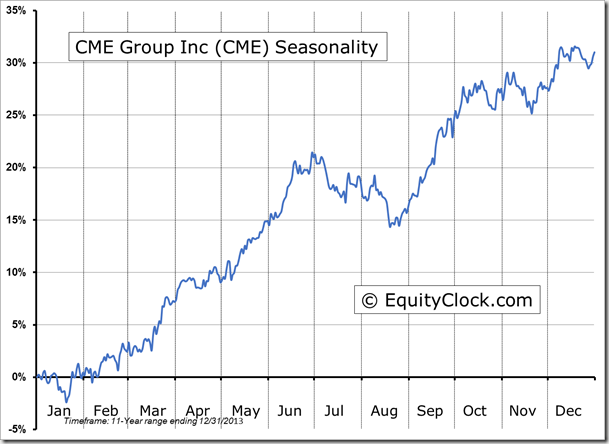
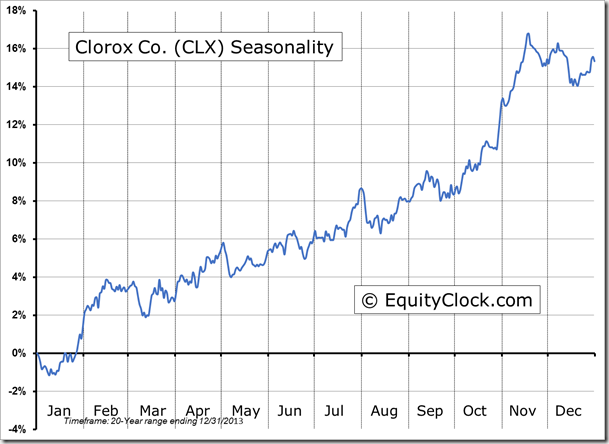
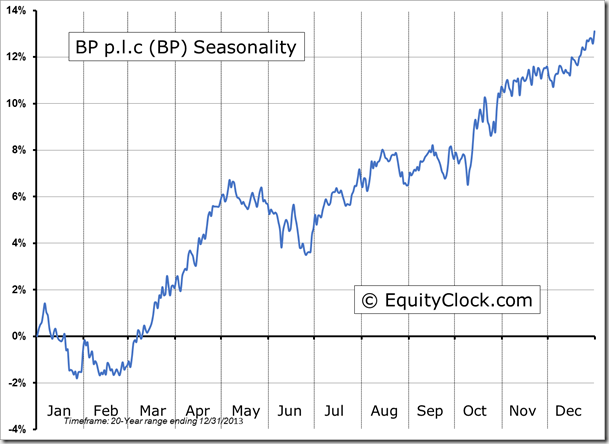
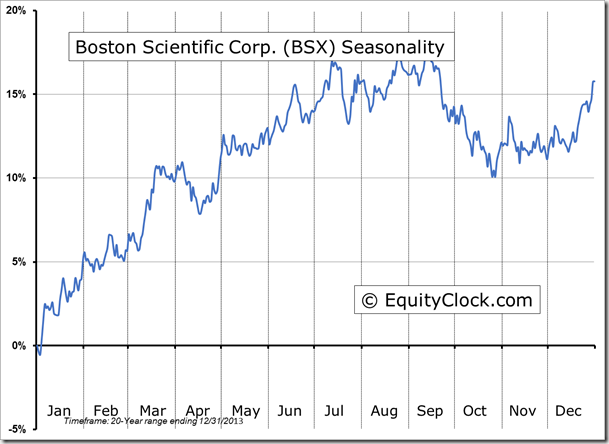
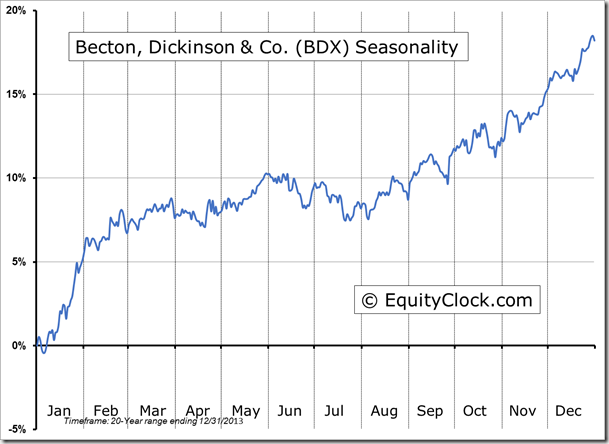
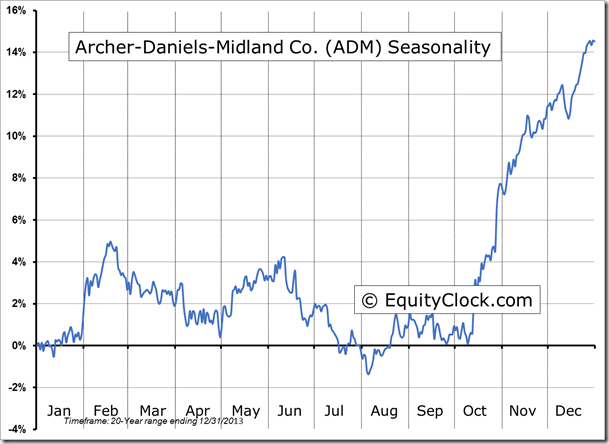
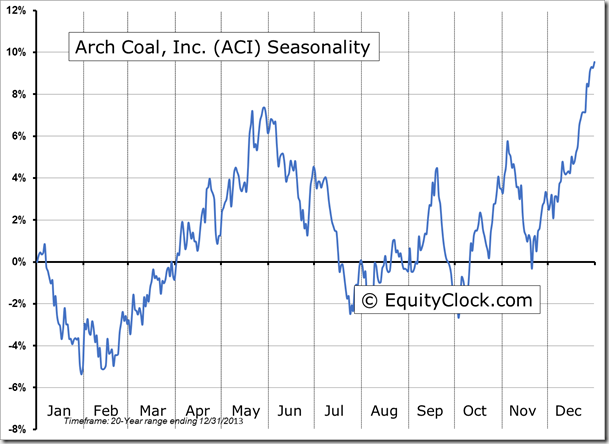
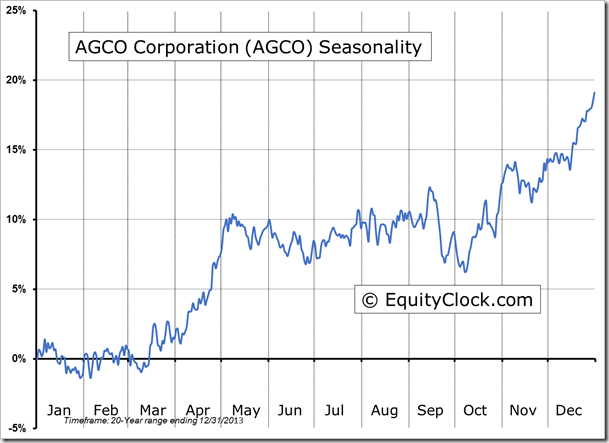
Seasonal charts of companies reporting earnings today:
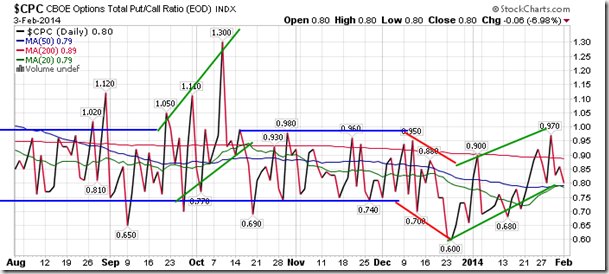
Sentiment on Monday, as gauged by the put-call ratio, ended bullish at 0.80. Despite the plunge in equity prices, fear has failed to materialize, as would be evident with a bearish reading above 1. Still, a bearish trend in the put-call ratio remains apparent following the overly euphoric/complacent low in the indicator that was recorded at the end of December.
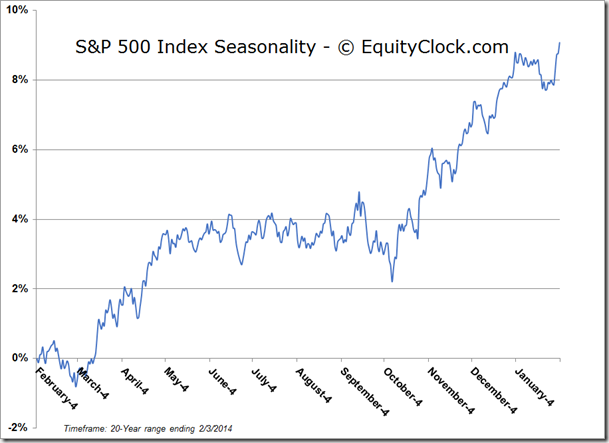
S&P 500 Index
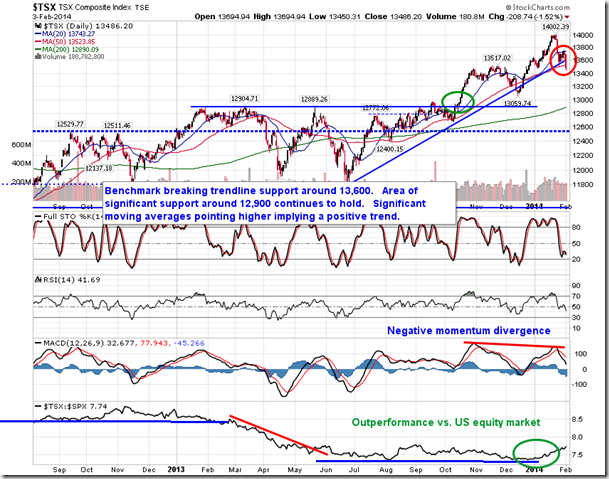
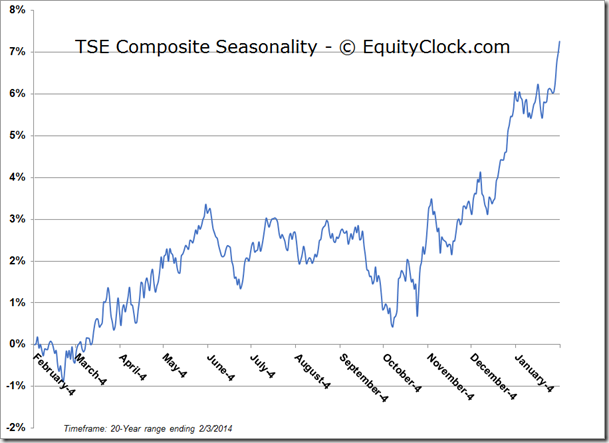
TSE Composite
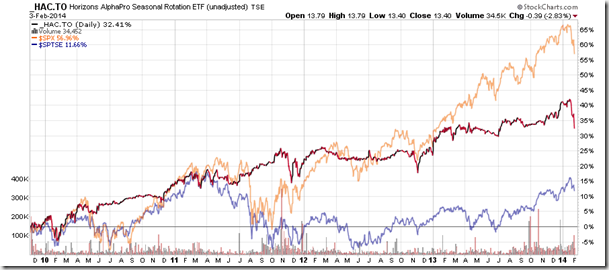
Horizons Seasonal Rotation ETF (TSX:HAC)
- Closing Market Value: $13.40 (down 2.83%)
- Closing NAV/Unit: $13.46 (down 2.35%)
Performance*
| 2014 Year-to-Date | Since Inception (Nov 19, 2009) | |
| HAC.TO | -5.87% | 34.6% |
* performance calculated on Closing NAV/Unit as provided by custodian

