EUR/USD
The euro remains under pressure and left lower tops at 1.3639, after fresh acceleration lower probes levels below 1.3585/74 supports. The way towards 1.35 base and key short-term support, is now open, as fresh weakness retraced nearly 76.4% of 1.3502/1.3699 rally. Bearish near-term studies support the notion, as daily tools are building bearish momentum for eventual completion of 1.3502/1.3699 phase, with probe below 1.35 base / main bull trendline off 1.2042 and return to another pivotal short-term support at 1.3475, 03 Feb higher low, to complete larger, Feb/May 1.3475/1.3699 ascend. Corrective rallies should find ideal cap at previous supports at 1.3585 and 1.3600, while only sustained break above the latter would delay immediate bears.
Resistance: 1.3574; 1.3585; 1.3600; 1.3625
Support: 1.3556; 1.3534; 1.3511; 1.3502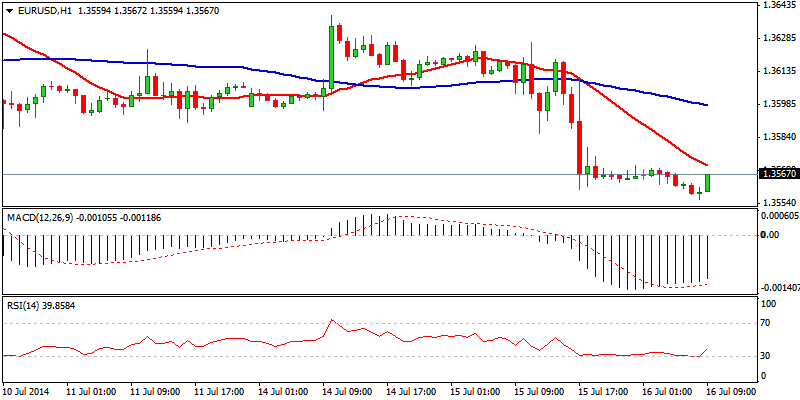
EUR/JPY
Near-term structure weakens, as recovery attempts off 137.48 low, ran out of steam at 134.40 zone and the price dipped back below 138 handle. Lower timeframes studies turned negative and bring downside risk in play, as yesterday’s inside day candle suggests change in near-term direction. Return to 137.48 to complete near-term corrective phase and likely to resume larger downtrend towards near-term target at 136.21, for eventual completion of 136.21/143.78 ascend. Negative daily studies support this scenario.
Resistance: 138.07; 138.43; 138.74; 138.81
Support: 137.66; 137.48; 137.00; 136.74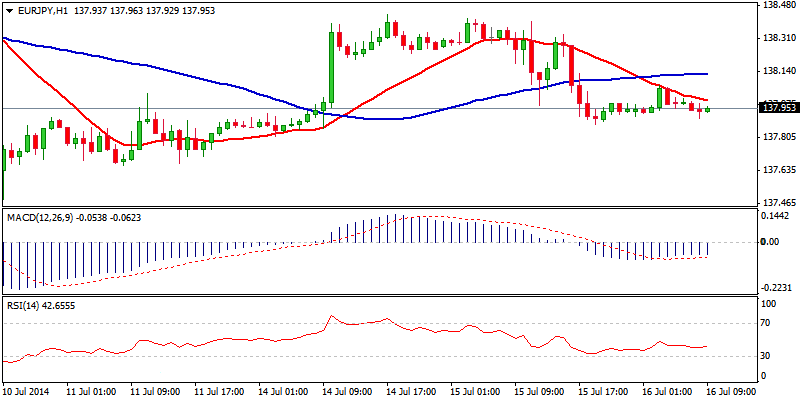
GBP/USD
Cable rallied sharply and escaped from dangerous territory, neutralizing downside risk, which started to build up on a break below 1.71 handle. Strong rebound recovered all near-term losses and posted marginally higher high at 1.7189. This brought near-term focus back to the upside levels, for resumption of larger uptrend, being paused by 1.7177/1.7057 corrective phase, with reversal signaled by bullish engulfing pattern. Positively aligned near-term studies and already bullish larger picture, support the notion, however, close above near-term tops is required to confirm.
Resistance: 1.7166; 1.7177; 1.7189; 1.7200
Support: 1.7123; 1.7108; 1.7095; 1.7068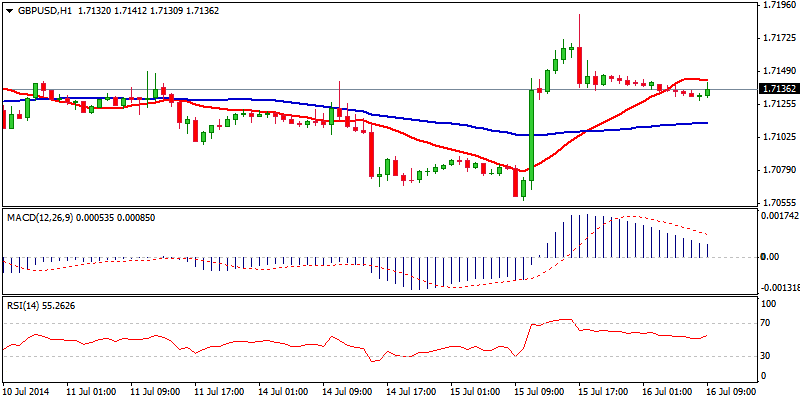
USD/JPY
The pair continues to move higher, on near-term corrective rally off fresh low at 101.05, posted on 05 July. Fresh extensions retraced over 76.4% of 102.25/101.05 descend, with positive near-term studies being supportive. The price action approaches the lower boundary, previous 09 July high / 200 SMA, of pivotal 101.85/102.00 resistance zone, break of which is required to confirm recovery. However, caution is still required as daily studies are weak and risk of lower top formation will persist while 102 barrier stays intact. Otherwise, break here to open next pivotal barriers at 102.25/35.
Resistance: 101.75; 101.85; 102.00; 102.25
Support: 101.62; 101.42; 101.37; 101.20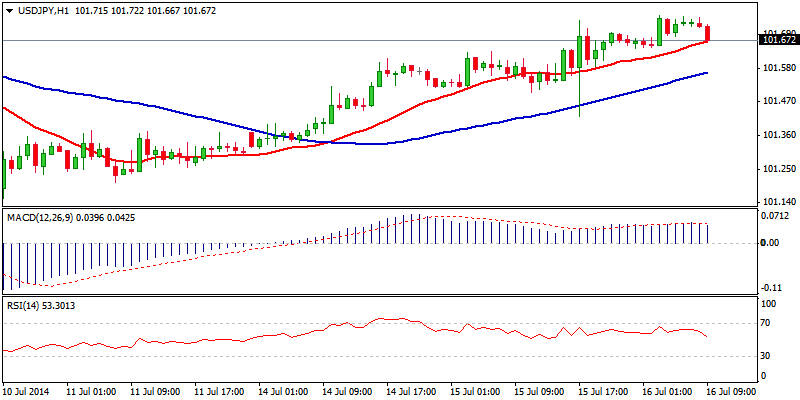
AUD/USD
Near-term recovery attempt lost traction after spiking at 0.9454 and subsequent weakness nearly fully retraced 0.9327/0.9454 upleg. This brought immediate risk at key 0.9320 higher platform and Fibonacci 61.8% retracement of 0.9209/0.9503 ascend, with break here to trigger fresh extension of reversal from 0.9503 peak, which was interrupted by 0.9327/0.9454 corrective rally. Negative near-term studies support further weakness, however, hesitation ahead of 0.9320 base could be expected, as hourly studies are oversold. Corrective rallies should stay under 0.94 barrier, to keep fresh bears intact.
Resistance: 0.9376; 0.9407; 0.9429; 0.9454
Support: 0.9327; 0.9320; 0.9300; 0.9250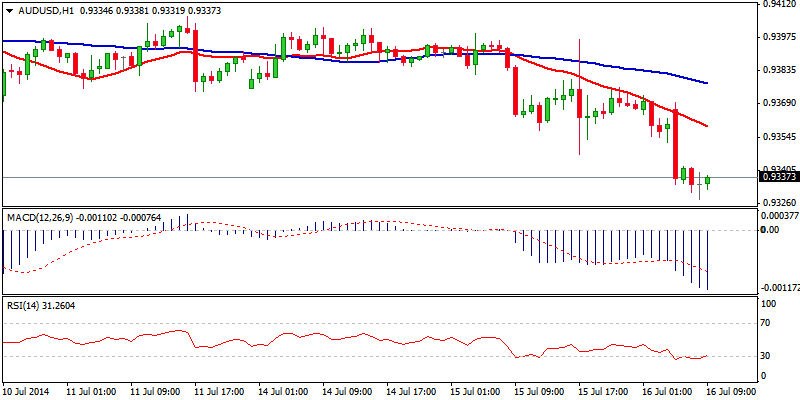
AUD/NZD
The pair trades in near-term corrective phase mode, after fresh bears found support at 1.0619. Upside acceleration regained initial barrier at 1.0730, which puts immediate bears on hold and opens way for stronger recovery. The notion is supported by positive near-term studies, with overbought hourly conditions suggesting a pause in the rally. Psychological 1.07 support should keep the downside protected, to keep upside attempts in play. Next targets lie at 1.08 and 1.0834, 02 July lower top.
Resistance: 1.0745; 1.0783; 1.0800; 1.0834
Support: 1.0730; 1.0700; 1.0660; 1.0635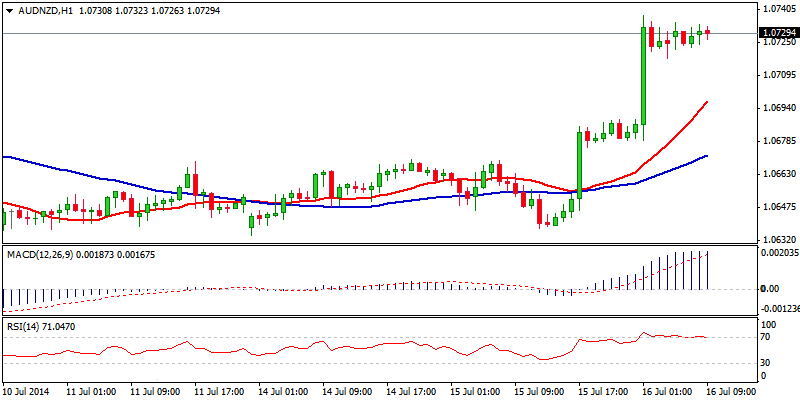
XAU/USD
Spot Gold has eventually broke below psychological 1300 support, on extension of bearish acceleration from fresh high at 1344. Daily close below 1300, confirms near-term bearish outlook and opens way for further retracement of 1240/1344 upleg, as the price already reached the next target at 1292, 50% retracement. Oversold near-term studies suggest corrective actions ahead of fresh attempts lower, with break below 1292 to open 1286, 200SMA and 1280, Fibonacci 61.8% retracement. Previous support at 1313, also lower top of 15 July and Fibonacci 38.2% of 1344/1292 descend, should limit rallies.
Resistance: 1300; 1304; 1313; 1318
Support: 1292; 1286; 1280; 1265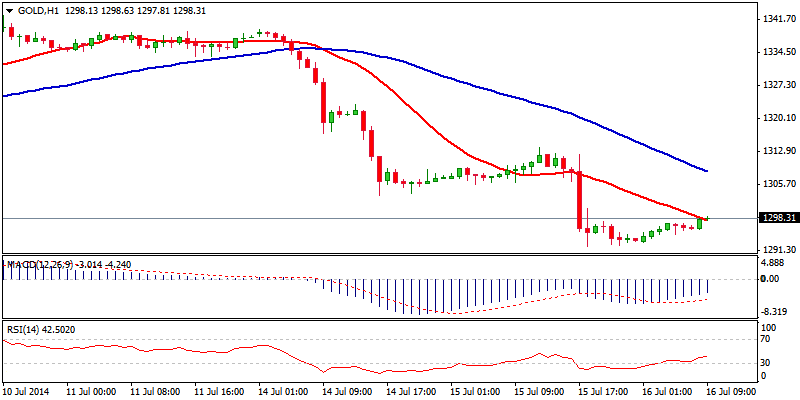
- English (UK)
- English (India)
- English (Canada)
- English (Australia)
- English (South Africa)
- English (Philippines)
- English (Nigeria)
- Deutsch
- Español (España)
- Español (México)
- Français
- Italiano
- Nederlands
- Português (Portugal)
- Polski
- Português (Brasil)
- Русский
- Türkçe
- العربية
- Ελληνικά
- Svenska
- Suomi
- עברית
- 日本語
- 한국어
- 简体中文
- 繁體中文
- Bahasa Indonesia
- Bahasa Melayu
- ไทย
- Tiếng Việt
- हिंदी
Market Outlook: Euro Under Pressure
Published 07/16/2014, 03:45 AM
Updated 02/21/2017, 08:25 AM
Market Outlook: Euro Under Pressure

FinFX
Latest comments
Install Our App
Risk Disclosure: Trading in financial instruments and/or cryptocurrencies involves high risks including the risk of losing some, or all, of your investment amount, and may not be suitable for all investors. Prices of cryptocurrencies are extremely volatile and may be affected by external factors such as financial, regulatory or political events. Trading on margin increases the financial risks.
Before deciding to trade in financial instrument or cryptocurrencies you should be fully informed of the risks and costs associated with trading the financial markets, carefully consider your investment objectives, level of experience, and risk appetite, and seek professional advice where needed.
Fusion Media would like to remind you that the data contained in this website is not necessarily real-time nor accurate. The data and prices on the website are not necessarily provided by any market or exchange, but may be provided by market makers, and so prices may not be accurate and may differ from the actual price at any given market, meaning prices are indicative and not appropriate for trading purposes. Fusion Media and any provider of the data contained in this website will not accept liability for any loss or damage as a result of your trading, or your reliance on the information contained within this website.
It is prohibited to use, store, reproduce, display, modify, transmit or distribute the data contained in this website without the explicit prior written permission of Fusion Media and/or the data provider. All intellectual property rights are reserved by the providers and/or the exchange providing the data contained in this website.
Fusion Media may be compensated by the advertisers that appear on the website, based on your interaction with the advertisements or advertisers.
© 2007-2024 - Fusion Media Limited. All Rights Reserved.