
EUR/USD
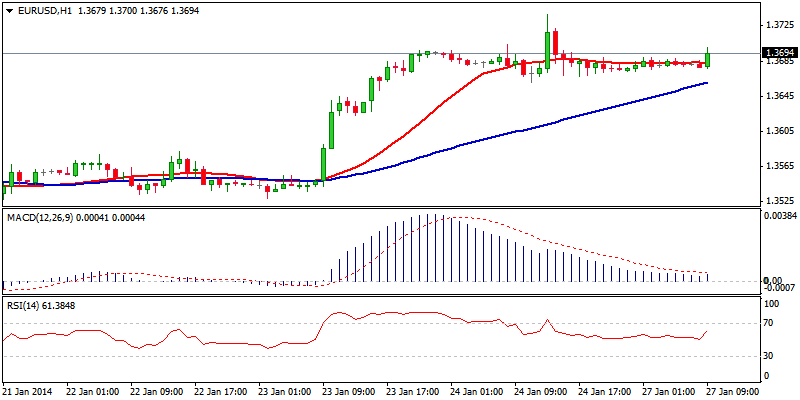
The euro maintains positive tone and consolidates under 1.37 barrier, previous peak and daily Kijun-sen which was dented on Friday’s spike to 1.3738, level last time traded on 02 Jan. Stretched 4-hour studies, see scope for extended consolidation, with immediate support at 1.3660, consolidation floor, reinforced by 38.2% of 1.3529/1.3838 upleg; hourly 55DMA and daily cloud top, loss of which would trigger corrective action towards 1.3634, 50% retracement and 1.36 zone, Fibonacci 61.8% / 20/55DMA’s bullish crossover, above which stronger dips should be contained. On the upside, clearance of 1.3700/38 barriers would open strong 1.38 resistance zone, December’s congestion tops.
Resistance: 1.3700; 1.3738; 1.3800; 1.3815
Support: 1.3660; 1.3634; 1.3600; 1.3580
 EUR/USD Hour Chart" title="EUR/USD Hour Chart" width="800" height="400">
EUR/JPY
The pair extended pullback off 145.67 peak and dipped below psychological / Fibonacci support at 140.00, to find footstep at 139.13. Corrective bounce above 140 barrier tests next layer of resistances at 140.30/48, previous lows, also 38.2% retracement of 142.40/139.13 downleg. Sustained break here is required to confirm near-term base and allow for stronger rally. However, overall tone remains negative, with bear-trendline off 145.67 at 141.50, expected to limit recovery attempts, as Head-and Shoulders-like pattern has been formed on a daily chart, supporting further weakness, once corrective phase is completed. Only break above the trendline resistance and pivotal 142.40 barrier would neutralize bears. On the downside, loss of 140.00 handle would open 139.50, daily cloud top and 139.13, session low for retest.
Resistance: 140.76; 141.00; 141.50; 141.70
Support: 140.00; 139.50; 139.13; 139.00 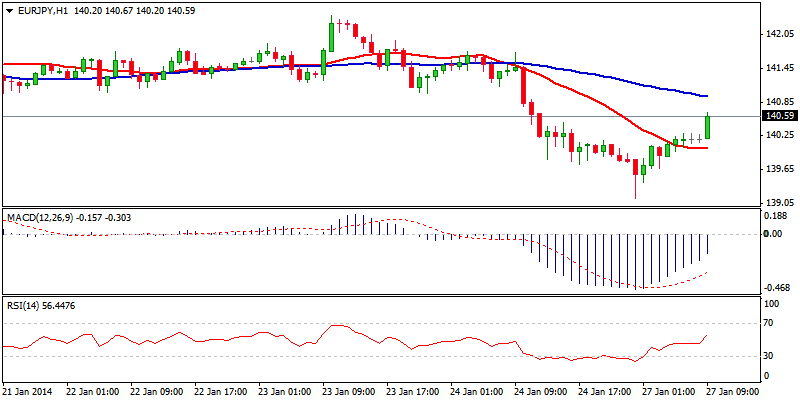 EUR/JPY Hour Chart" title="EUR/JPY Hour Chart" width="800" height="400">
GBP/USD
Cable lost traction and ended Friday’s trading in red after strong pullback from fresh peak at 1.6668, probed below 1.65 handle and found temporary footstep at 1.6472. Reversal retraced over 50% of 1.6307/1.6668 rally that weakened near-term structure, as hourly studies turned negative and 4-hour indicators approaching the midlines. Larger picture bulls, however, remain intact and expected to resume higher after completion of corrective phase. Bounce off 1.6472 that probes above 1.65 barrier, would face broken bull-trendline off 1.6307 and 1.6550, above which to signal further recovery and avert immediate downside risk. Break above 1.66 hurdle is required to confirm. On the other-side, limited corrective action would keep the downside vulnerable, as slide below 1.65 handle would bring fresh weakness for retest of 1.6472 and 1.6445, Fibonacci 61.8% of 1.6307/1.6668; 1.6400, psychological support in extension.
Resistance: 1.6550; 1.6600; 1.6622; 1.6642
Support: 1.6500; 1.6472; 1.6445; 1.6400 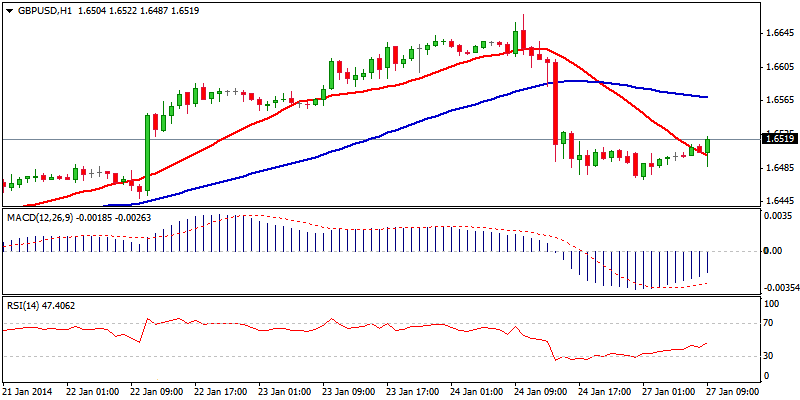 GBP/USD Hour Chart" title="GBP/USD Hour Chart" width="800" height="400">
USD/JPY
The pair enters near-term corrective phase off fresh low at 101.75, after two-legged weakness off 104.83, 23 Jan lower top slid through important 102.84 and 102.00 supports. Overall negative tone, established after repeated rejections at 105 hurdle and acceleration lower, keep the downside favored in the near-term, with fresh leg lower seen on a completion of corrective rally. Crack of initial 102.70 resistance, opens more significant 103.00 barrier, Fibonacci 38.2% of 104.83/101.75 descend, reinforced by hourly 55DMA and pivotal 103.57, 24 Jan lower top / near 61.8% retracement, where rallies should be ideally capped. Otherwise, break here would sideline near-term bears and shift focus higher. Initial support lies at 102.50, daily cloud top, ahead of 102.00 and 101.75 low, loss of which to confirm bearish resumption.
Resistance: 102.84; 103.00; 103.29; 103.57
Support: 102.50; 102.00; 101.75; 101.60 
AUD/USD
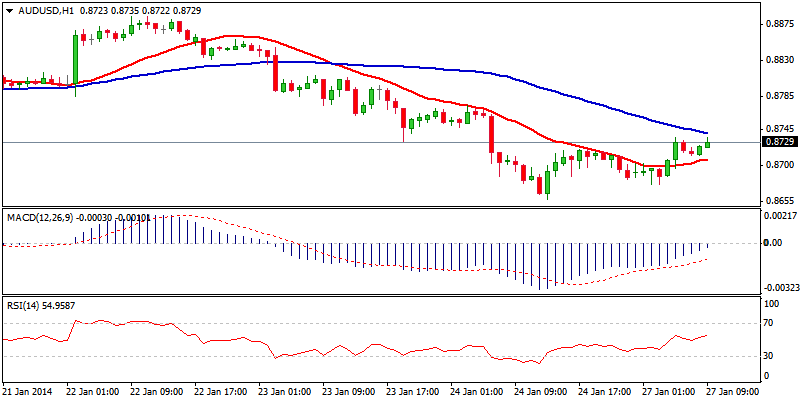
The pair remains under pressure, as fresh weakness posted new low at 0.8658, initial target of Fibonacci 61.8% expansion of the wave from 0.9755 lower top. Corrective bounce above 0.87 barrier, so far holds below initial 0.8745/55 resistance, Fibonacci 38.2% retracement of 0.8886/0.8658 descend / hourly 55DMA / previous low, with break higher to confirm recovery mode. North heading hourly indicators support the notion, as 4-hour indicators are starting to reverse. However, overall negative structure keeps the downside at risk, with regain of minimum 0.88 barrier, required to ease bear-pressure and delay fresh bears. On the downside, psychological 0.87 level offers initial support, ahead of 0.8676, session low and 0.8658, loss of which to resume larger bears and expose 0.8600 and 0.8543, 50% retracement of multi-year 0.6007/1.1079 rally.
Resistance: 0.8745; 0.8755; 0.8800; 0.8832
Support: 0.8700; 0.8676; 0.8658; 0.8600
 AUD/USD Hour Chart" title="AUD/USD Hour Chart" width="800" height="400">
AUD/NZD
The pair enters near-term corrective phase after fresh bears dented psychological 1.0500 support, on extension to 1.0488, fresh 9-year low, where temporary footstep was found. Further corrective action requires break above 1.06 barrier to ease immediate downside pressure and open 1.0670/1.0700 hurdle for retest, where stronger rallies should be capped, before bears re-assert for final push towards target at 1.0432, 2005 low.
Resistance: 1.0605; 1.0624; 1.0668; 1.0700
Support: 1.0532; 1.0500; 1.0488; 1.0432 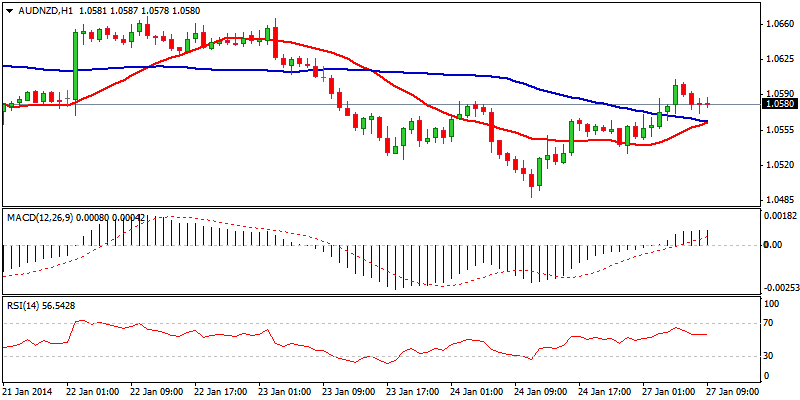 AUD/NZD Hour Chart" title="AUD/NZD Hour Chart" width="800" height="400">
XAU/USD
Spot Gold remains supported and continues to trend higher, as fresh extension above pivotal 1267 barrier, confirmed double-bottom formation and tested next barrier at 1278, Fibonacci 38.2% retracement of 1433/1182 descend. Corrective pullback faces good support at 1267, previous high, ahead of 1260, 24 Jan higher low / 38.2% retracement of 1231/1278 upleg / hourly 55DMA, where dips should be ideally contained. Resumption of the uptrend through 1278 to open 1294, 14 Nov lower top and psychological 1300 barrier in extension. Only slide below 1360 would delay immediate bulls for stronger pullback.
Resistance: 1272; 1278; 1285; 1294
Support: 1267; 1260; 1254; 1249 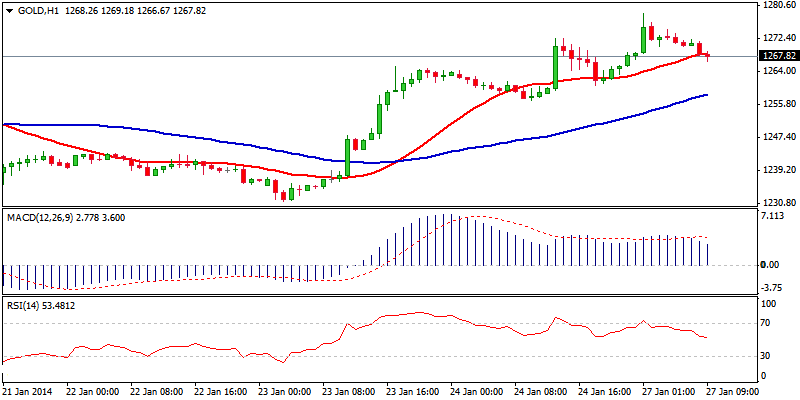 XAU/USD Hour Chart" title="XAU/USD Hour Chart" width="800" height="400">