
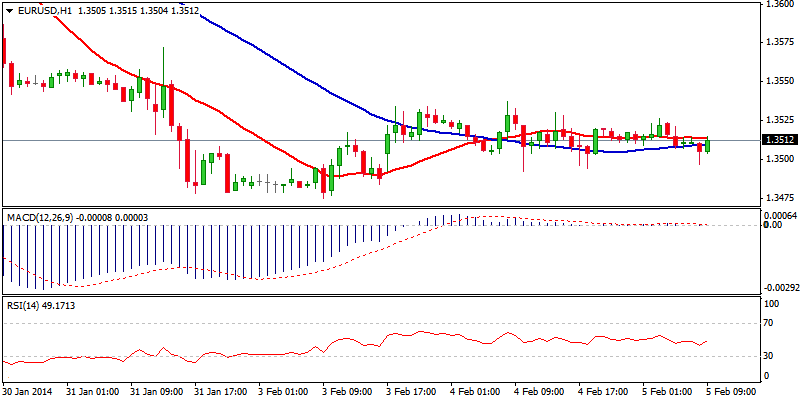
EUR/USD
The euro is unchanged and moves within narrow consolidative range of 1.3490 and 1.3535, with hourly studies in neutral mode. Overall negative tone, however, keeps the downside at pressure, as corrective attempt from 1.3475 low is so far capped by falling 4-hour 20SMA, keeping more significant barriers at 1.3580 and 1.3600 intact for now. Fresh weakness below 1.3500/1.3475 supports to open 1.3457, Fibonacci 38.2% of 1.2754/1.3892 then 1.3435, Fibonacci 76.4% of 1.3294/1.3738 upleg and psychological / higher platform support at 1.3400 in extension. On the upside, break above pivotal 1.3600 resistance zone, 50% retracement of 1.3738/1.3475 / daily Ichimoku cloud base, would provide relief.
Resistance: 1.3540; 1.3572; 1.3600; 1.3638
Support: 1.3492; 1.3475; 1.3457; 1.3435
 EUR/USD Hour Chart" title="EUR/USD Hour Chart" width="800" height="400">
EUR/JPY
The pair continues to trend lower, with fresh bears through 137 handle and 136.73, Fibonacci 61.8% retracement of 131.20/145.67 rally, extending to the levels close to psychological 136 support. Firm bears see further weakness as likely scenario, with break below 136 handle expected to open 135.50, Oct 2013 tops and psychological 135 support in extension. Corrective action on oversold near-term studies, is expected to precede fresh extension lower. Extension above initial resistance at 137, so far tested 137.42, previous lows / 23.6% of 141.23/136.21, where 55SMA caps for now and keeps pivotal 138.13, Fibonacci 38.2% of 141.23/136.21 downleg intact.
Resistance: 137.17; 137.42; 138.13; 138.65
Support: 136.21; 136.00; 135.50; 135.00 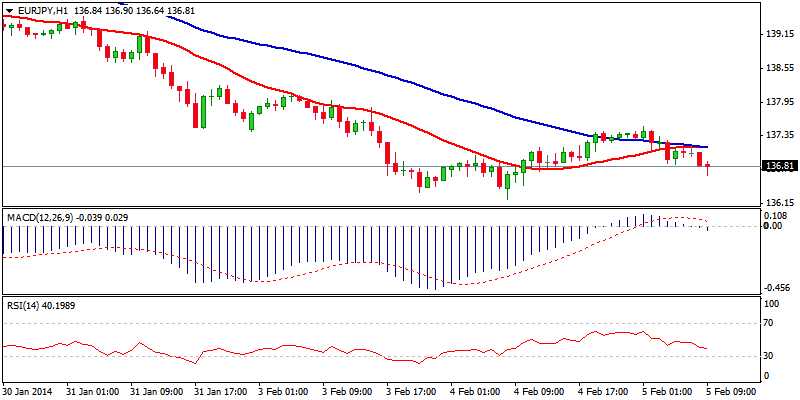 EUR/JPY Hour Chart" title="EUR/JPY Hour Chart" width="800" height="400">
GBP/USD
The Cable rides on the fourth, corrective wave, as a part of larger downtrend from 1.6668, 24 Jan peak, after the third wave extended below its 161.8% expansion and ended at 1.6255. The fourth wave could travel to 1.6400 barrier, where gains should be ideally capped, with the fifth wave expected to extend towards 1.6200/1.6150 zone, where daily cloud base and Fibonacci 61.8% retracement of 1.5853/1.6668, offer supports. Only break above 1.6400 barrier would delay bears and allow for stronger recovery towards 1.6440/80 barriers.
Resistance: 1.6343; 1.6400; 1.6440; 1.6500
Support: 1.6289; 1.6255; 1.6236; 1.6215 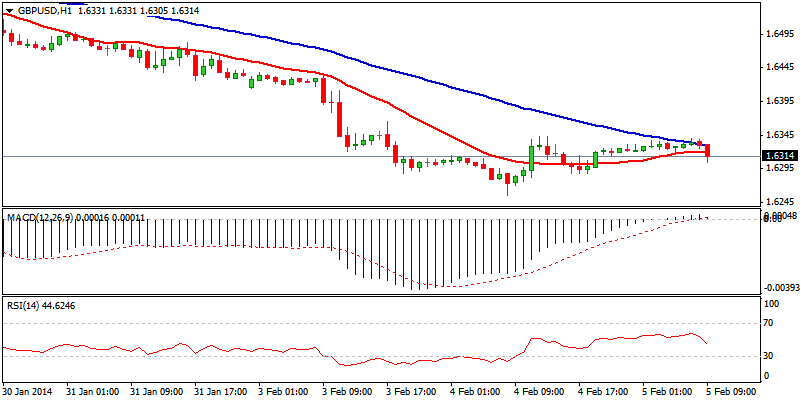 GBP/USD Hour Chart" title="GBP/USD Hour Chart" width="800" height="400">
USD/JPY
The pair enters near-term corrective mode after finding good support at 100.74, with corrective rally being capped by previous low at 101.75, also hourly 55SMA. With hourly studies losing traction and 4-hour technicals maintaining negative tone, upside attempts are seen limited and downside risk remains in play. Violation of initial 101 support is expected to open hourly double-bottom at 100.74, loss of which to resume broader bears off 105.43 and expose psychological 100 support, reinforced by 50% retracement of 96.55/105.43 rally and 200SMA. Only break above psychological 102 barrier and 102.50, Fibonacci 38.2% retracement, would delay bears.
Resistance: 101.75; 102.00; 102.50; 102.92
Support: 101.00; 100.74; 100.42; 100.00 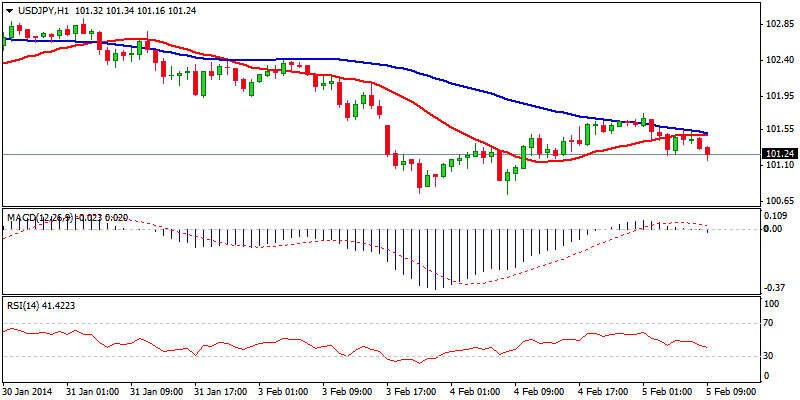 USD/JPY Hour Chart" title="USD/JPY Hour Chart" width="800" height="400">
AUD/USD
The pair trades in near-term consolidative phase, after fresh bulls were triggered on a break above one week congestion tops at 0.8820 zone, with acceleration through important barrier at 0.8886, 22 Jan lower top and psychological 0.89 barrier, posting fresh 3-week high at 0.8940. The pullback off 0.8940 was so far contained by daily Kijun-sen line at 0.8870 that marks consolidation floor, however, weakening hourly studies cannot rule out further easing. Next support lies at 0.8859, Fibonacci 38.2% of 0.8729/0.8940 upleg and 0.8835, 50% retracement, with dips expected to hold above previous congestion tops at 0.8820 zone, to keep fresh bulls in play. Extension of the uptrend through temporary cap at 0.8940 is expected to focus 0.9000, psychological resistance / 03 Jan high and key barrier at 0.9084, 13 Jan peak, in extension.
Resistance: 0.8906; 0.8940; 0.8983; 0.9000
Support: 0.8870; 0.8859; 0.8824; 0.8800 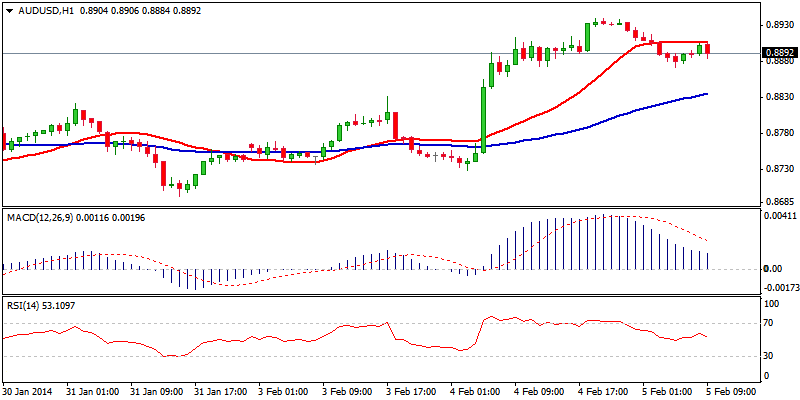 AUD/USD Hour Chart" title="AUD/USD Hour Chart" width="800" height="400">
AUD/NZD
The pair corrects recent rallies that peaked at 1.0942 and completed near-term bear-leg from 1.0911 to 1.0488. Quick pullback off 1.0942 was contained by 4-hour 20SMA at 1.0810, where the price consolidates. Further consolidation is seen as likely near-term scenario, as indecision was signaled by yesterday’s Doji, with mixed near-term studies supporting the notion. More negative tone is expected to come in play in case of clear break below 1.0800 handle, also Fibonacci 38.2% of 1.0557/1.0942 rally that would delay bulls. On the other side, fresh acceleration higher and break above 1.0942 peak, would bring bulls fully in play and open next target at 1.1000, psychological barrier and Fibonacci 138.2% projection of the upleg from 1.0488.
Resistance: 1.0873; 1.0900; 1.0942; 1.1000
Support: 1.0800; 1.0750; 1.0723; 1.0700 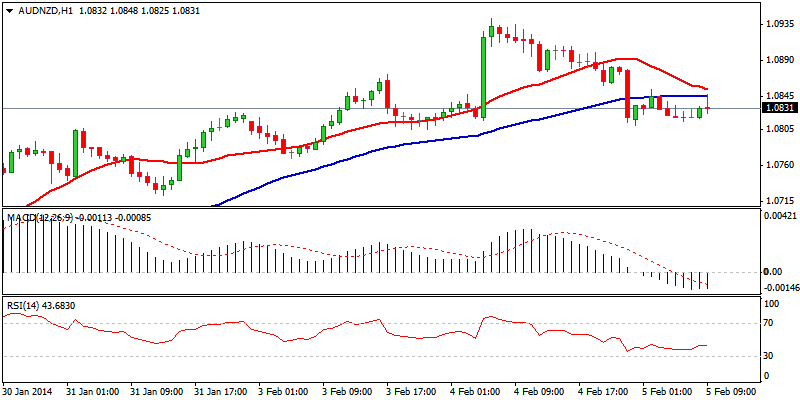 AUD/NZD Hour Chart" title="AUD/NZD Hour Chart" width="800" height="400">
XAU/USD
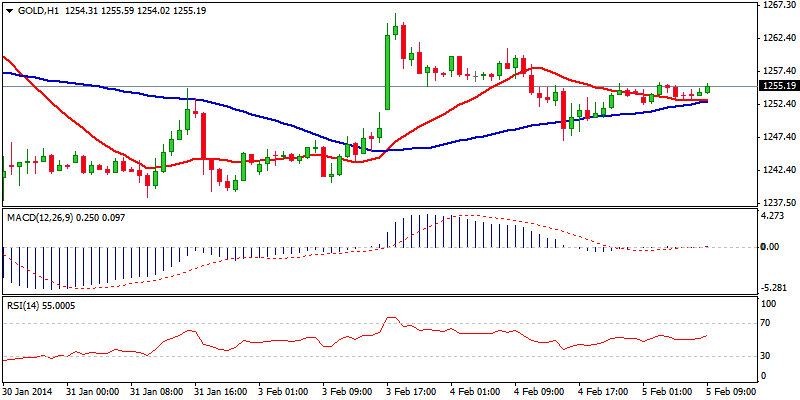
Spot Gold is regaining traction in the near-term technicals after two-legged pullback from 1266 upside rejection, found footstep at 1247, near Fibonacci 61.8% retracement of 1237/1266 rally. Subsequent bounce that retraced over 50% of 1266/1247 descend, shifts near-term focus higher. However, regain of lower platform at 1260 is seen as minimum requirement to confirm bullish scenario and higher low at 1247 and open 1266 breakpoint for eventual full retracement of 1269/1237 bear-leg. Higher platform at 1252, reinforced by hourly 55SMA, should keep the downside protected to avert risk of return to 1247 and further weakness seen on violation of the latter.
Resistance: 1260; 1266; 1269; 1273
Support: 1252; 1247; 1244; 1237
 XAU/USD Hour Chart" title="XAU/USD Hour Chart" width="800" height="400">