EUR/USD
The euro showed limited action during past few sessions, with price action moving within narrow 1.3880/1.3940 range, awaiting today’s FOMC decision. Hourly tone is neutral, as the price forms bullish pennant, while larger pictures maintain positive tone and favor eventual push towards short-term target at 1.4000. Recent range tops, along with bear-trendline off 1.3965, offer initial resistance, ahead of fresh high at 1.3965 and psychological 1.4000 barrier, also daily channel resistance. Break here to resume larger uptrend, interrupted by 1.3965/1.3840 corrective phase and expose next targets at 1.4056, double-Fibonacci resistance 138.2% expansion of the third wave from 1.3642 and 138.2% projection of the downmove from 1.3892 to 1.3475. Narrowed range floor at 1.3880 offers immediate support, ahead of the first pivot at 1.3840 higher platform / Fibonacci 38.2% retracement of 1.3642/1.3965 upleg and only break here would sideline near-term bulls in favor of deeper pullback towards 1.3800, 50% retracement / channel support; 1.3765, Fibonacci 61.8% retracement of 1.3642/1.3965 rally and 1.3700, higher base / round-figure support / 76.4% retracement.
Resistance: 1.3946; 1.3965; 1.4000; 1.4056
Support: 1.3900; 1.3880; 1.3840; 1.3800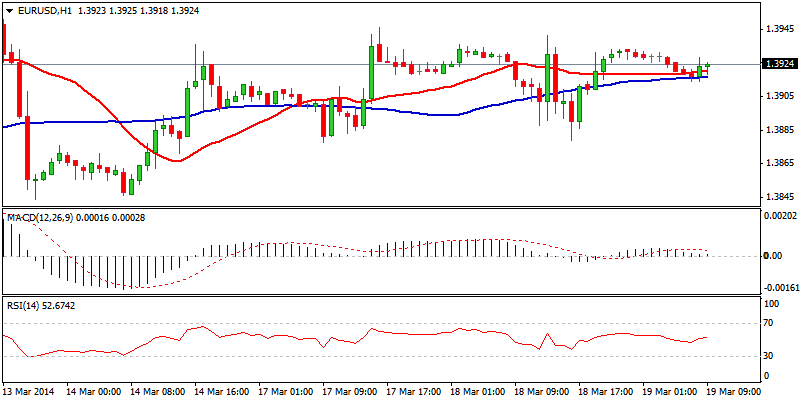 EUR/USD Hour Chart" title="EUR/USD Hour Chart" width="800" height="400" />
EUR/JPY
The pair remains in extended sideways mode, consolidating last week’s sharp fall that bottomed at 140.43. Consolidative / corrective action is for now capped under initial barrier at 142.00, with near-term studies being negatively aligned that keeps the downside at risk. Break below the first support at 141.00, round-figure / trendline support to open 140.72 and pivotal 140.43, below psychological 140.00 support, also mid-point of 136.21/143.78 rally, will be open for test. Alternatively, sustained break above 142.00 handle and lift above 142.23, Fibonacci 61.8% retracement of 143.34/140.43 downleg / previous low of 12 Mar, would avert immediate downside risk for stronger recovery.
Resistance: 142.00; 142.23; 142.63; 143.00
Support: 141.00; 140.79; 140.43; 140.00 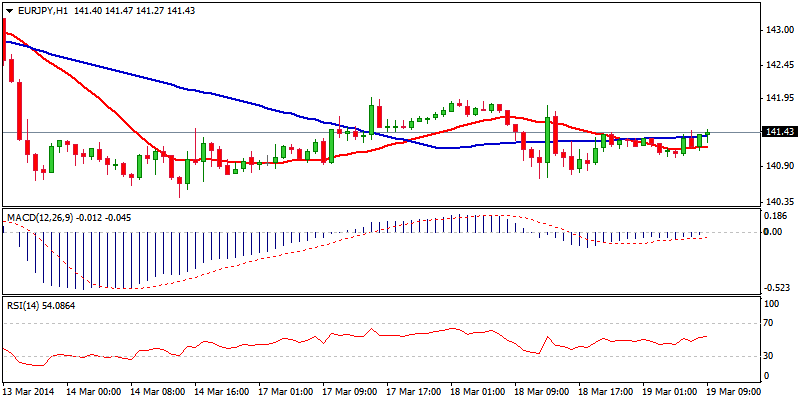 EUR/JPY Hour Chart" title="EUR/JPY Hour Chart" width="800" height="400" />
GBP/USD
Cable came under pressure and ended the second day in red, after fresh weakness broke below near-term range floor, to post fresh low at 1.6544, where daily 55SMA contained dips for now. Weak near-term studies favor further downside, with psychological 1.6500 support, also daily Ichimoku cloud top coming next, ahead of 1.6451, Fibonacci 38.2% retracement of larger 1.5853/1.6821 ascend. Corrective rallies are expected to precede fresh leg lower, with regain of 1.66 handle expected to open 1.6646/64 barriers, where rallies should be ideally contained. Pivotal resistance lies at 1.6716, 13 Mar peak and only break here to improve near-term structure.
Resistance: 1.6608; 1.6646; 1.6664; 1.6700
Support: 1.6544; 1.6500; 1.6451; 1.6400 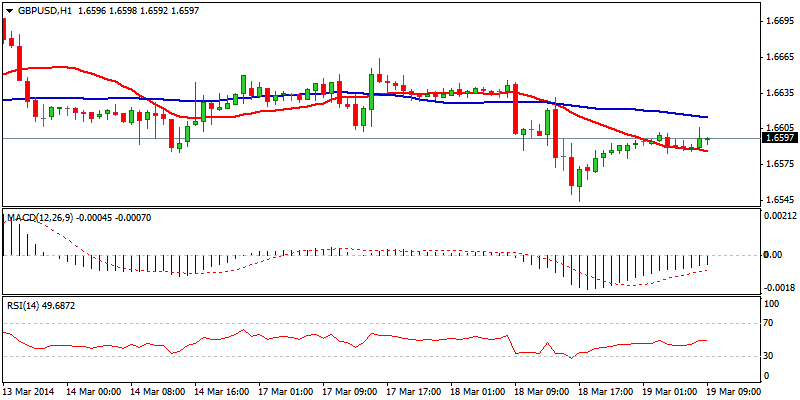 GBP/USD Hour Chart" title="GBP/USD Hour Chart" width="800" height="400" />
USD/JPY
Near-term price action moves in a consolidative mode above fresh low at 101.19, after the pair fully retraced 101.19/103.75 upleg. Near-term tone remains weak, as recovery attempts were capped under psychological 102 barrier, with descending 4-hour SMA limiting the upside for now and bull-trendline off 100.74 low being cracked. Break below 101.19 handle is required to open another significant support at 100.74, 03/05 Feb base and psychological 100 support in extension. Only break above 102.50 and 102.80, Fibonacci 61.8% retracement of 103.75/101.19 would improve near-term structure.
Resistance: 101.93; 102.17; 102.50; 102.80
Support: 101.29; 101.19; 101.00; 100.74 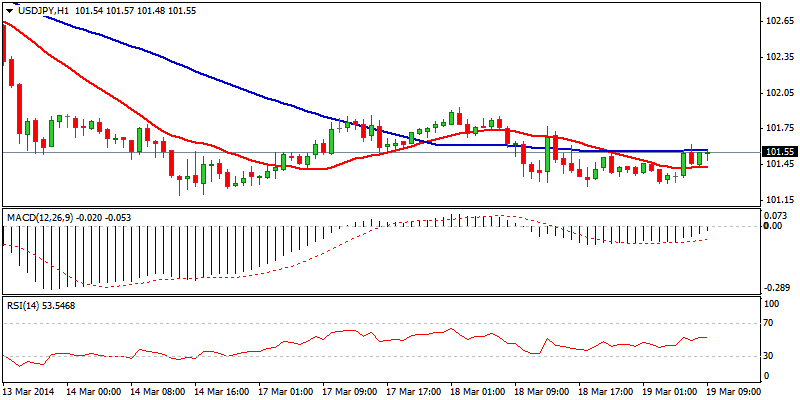 USD/JPY Hour Chart" title="USD/JPY Hour Chart" width="800" height="400" />
AUD/USD
The pair maintains positive near-term tone and eventually broke above psychological 0.9100 barrier, to crack key near-term resistance and pivotal point at 0.9132, on extension to 0.9137 so far. Positive near-term technicals keep the upside favored, with clear break above of 0.9132 barrier, expected to open 0.9151, 200SMA; 0.9165, 10 Dec 2013 high and 0.9206, 50% retracement of larger 0.9755/0.8658 descend. Corrective dips would face initial support at 0.91 zone, also hourly 55SMA and higher low at 0.9062, Fibonacci 38.2% retracement of 0.8923/0.9137, seen as ideal reversal point to keep bulls intact.
Resistance: 0.9137; 0.9151; 0.9165; 0.9206
Support: 0.9100; 0.9060; 0.9030; 0.9000 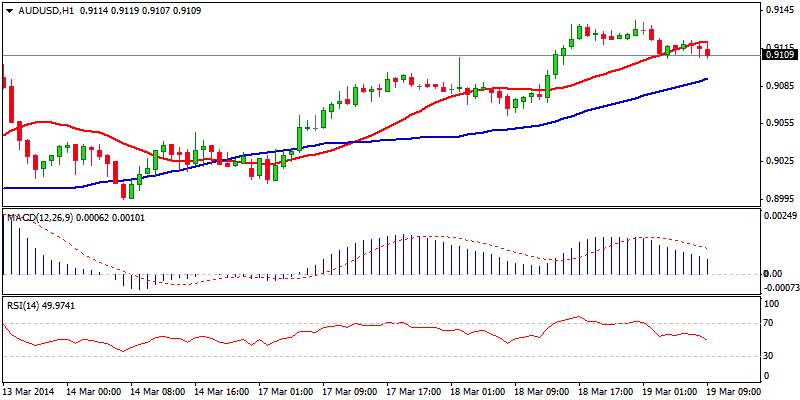 AUD/USD Hour Chart" title="AUD/USD Hour Chart" width="800" height="400" />
AUD/NZD
The cross trades in extended consolidative phase off fresh low at 1.0534, posted last week. Brief attempts above initial 1.0600 barrier were short-lived, with upside being capped by descending 4-hour 55SMA that keeps hourly studies weak. Also negatively aligned 4-hour technicals see limited upside actions for now and the downside at risk, as daily studies are bearish. Likely near-term scenario is seen on a fresh weakness through 1.0543 for extension to the short-term target and key support at 1.0488, 24 Jan low, to fully retrace 1.0488/1.0942 ascend and possibly trigger fresh leg lower on a break. Only break above 1.0644, 12 Mar spike high / 50% retracement of 1.0755/1.0534 downleg and daily Tenkan-sen line, would sideline near-term bears and signal stronger recovery towards 1.0671, 61.8% retracement; psychological 1.0700 and pivotal 1.0755, 07 Mar lower top.
Resistance: 1.0615; 1.0644; 1.0671; 1.0700 "
Support: 1.0565; 1.0534; 1.0500; 1.0488 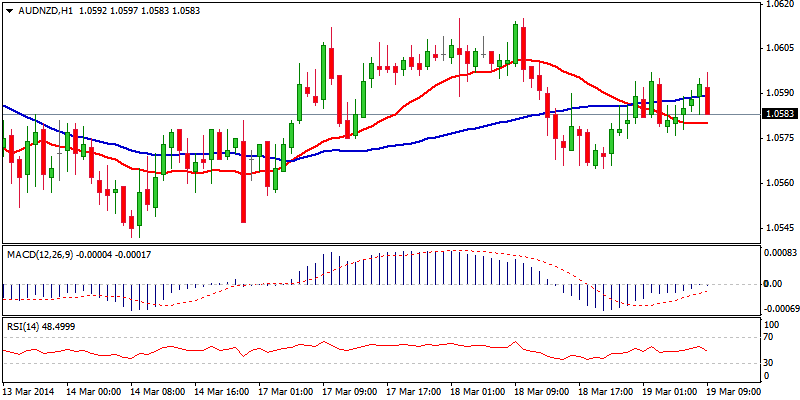 AUD/NZD Hour Chart" title="AUD/NZD Hour Chart" width="800" height="400" />
XAU/USD
Spot Gold trades in extended corrective phase off fresh high at 1392, where bulls stalled on approach to psychological 1400 barrier. Fresh weakness reached 1350, near 61.8% retracement of 1319/92 rally, where the price found temporary footstep. With near-term studies being negative and limited corrective action capped by hourly 20SMA at 1362, downside remains at risk. Extension below 1350/47 supports to resume near-term bears and expose next supports at 1336, Fibonacci 76.4% retracement and 1327 higher platform in extension. Only lift above the first pivot at 1364 would delay bears and allow for stronger rally.
Resistance: 1359; 1364; 1374; 1382
Support: 1350; 1347; 1336; 1327 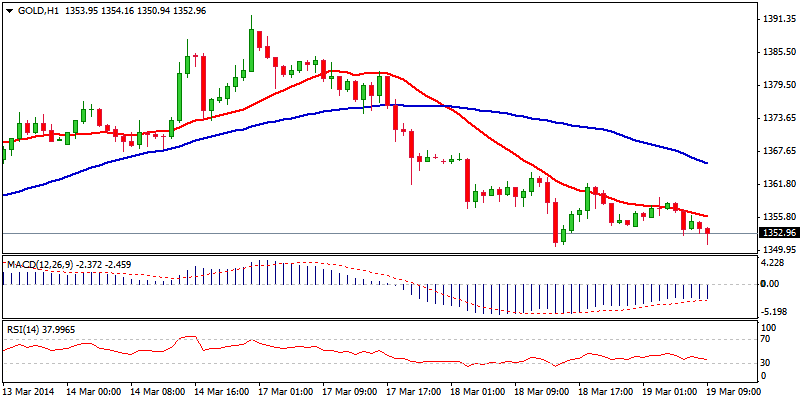 XAU/USD Hour Chart" title="XAU/USD Hour Chart" width="800" height="400" />
- English (UK)
- English (India)
- English (Canada)
- English (Australia)
- English (South Africa)
- English (Philippines)
- English (Nigeria)
- Deutsch
- Español (España)
- Español (México)
- Français
- Italiano
- Nederlands
- Português (Portugal)
- Polski
- Português (Brasil)
- Русский
- Türkçe
- العربية
- Ελληνικά
- Svenska
- Suomi
- עברית
- 日本語
- 한국어
- 简体中文
- 繁體中文
- Bahasa Indonesia
- Bahasa Melayu
- ไทย
- Tiếng Việt
- हिंदी
Market Outlook: Cable Comes Under Pressure
Published 03/19/2014, 04:52 AM
Updated 02/21/2017, 08:25 AM
Market Outlook: Cable Comes Under Pressure

FinFX
Latest comments
Install Our App
Risk Disclosure: Trading in financial instruments and/or cryptocurrencies involves high risks including the risk of losing some, or all, of your investment amount, and may not be suitable for all investors. Prices of cryptocurrencies are extremely volatile and may be affected by external factors such as financial, regulatory or political events. Trading on margin increases the financial risks.
Before deciding to trade in financial instrument or cryptocurrencies you should be fully informed of the risks and costs associated with trading the financial markets, carefully consider your investment objectives, level of experience, and risk appetite, and seek professional advice where needed.
Fusion Media would like to remind you that the data contained in this website is not necessarily real-time nor accurate. The data and prices on the website are not necessarily provided by any market or exchange, but may be provided by market makers, and so prices may not be accurate and may differ from the actual price at any given market, meaning prices are indicative and not appropriate for trading purposes. Fusion Media and any provider of the data contained in this website will not accept liability for any loss or damage as a result of your trading, or your reliance on the information contained within this website.
It is prohibited to use, store, reproduce, display, modify, transmit or distribute the data contained in this website without the explicit prior written permission of Fusion Media and/or the data provider. All intellectual property rights are reserved by the providers and/or the exchange providing the data contained in this website.
Fusion Media may be compensated by the advertisers that appear on the website, based on your interaction with the advertisements or advertisers.
© 2007-2024 - Fusion Media Limited. All Rights Reserved.