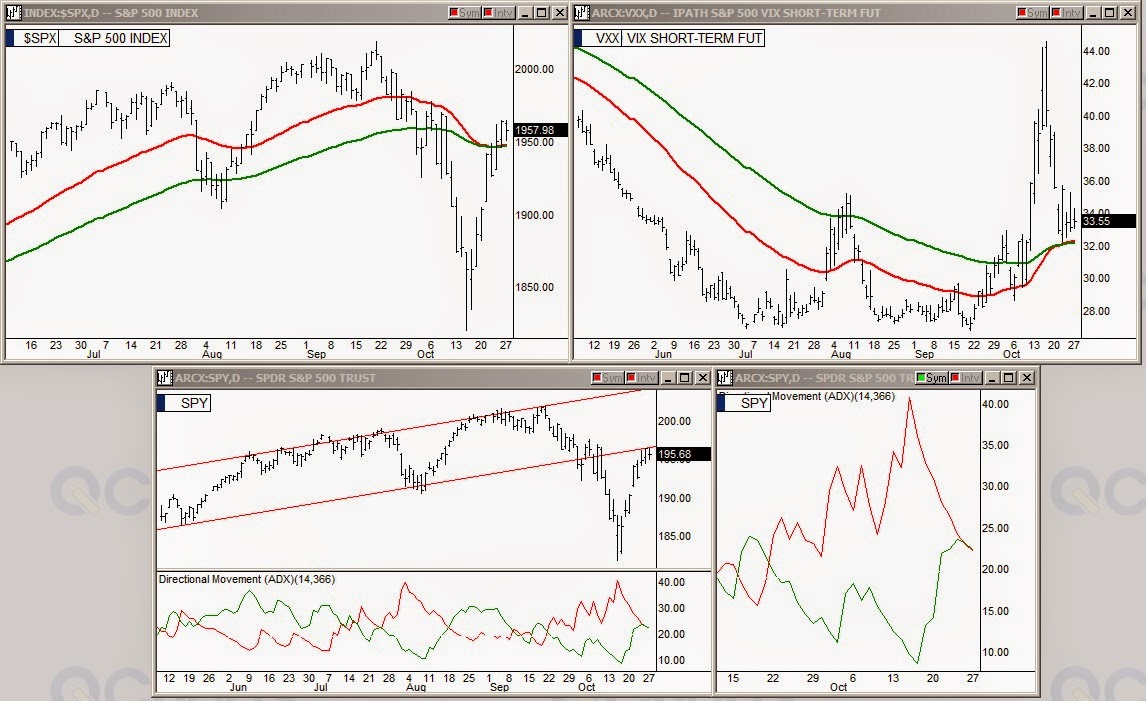
In the market Monday we saw day two of a powerful tractor program that has been clamped down on the SPDR S&P 500 (ARCA:SPY) and PowerShares QQQ (NASDAQ:QQQ) to keep the S&P 500 and the NASDAQ in a tight slightly uphill range. This program has actually solidified the standoff between the two EMA lift setups of the S&P and iPath S&P 500 Vix Short Term Fut (ARCA:VXX).
Looking at the two upper charts above both showing the same large EMAs on the S&P and VXX, we still have a stalemate situation as the VXX is ready to lift and cause a market sell off but the Fed refuses to let that happen and has forced the S&P into the same pancake line bounce setup as the VXX which is something that is rarely seen. One or the other has to drop soon as such these inversely traded entities cannot both stay in identical lift setups.
Looking at the two lower charts above, I have inlaid the ADX active lines at the bottom of the SPY chart. You can view the green line as buyers and the red line as sellers. Here once again it shows we are stuck at a neutral stalemate waiting for the pivot in both indexes to break one way or the other. The focus chart in the bottom right corner is a zoom in on the SPY ADX and if you look closely at the monitor you can see that the red line is very slightly under the green line indicating the beginning of bullishness but the green line is falling also instead of turning up which indicates the buyers are backing off also at this pivot. No clear indication which way the market may break yet.

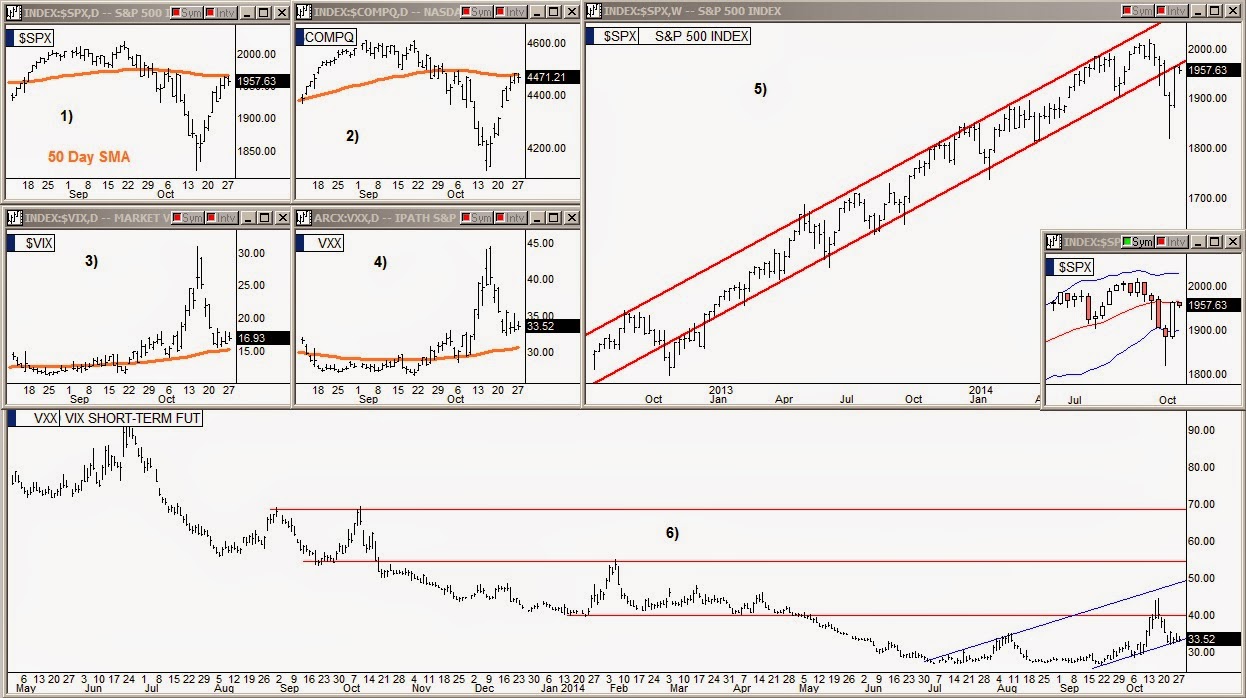
Looking at the second chart cluster above, we see that in chart 1 the S&P is showing resistance at its 50 SMA. Chart 5 shows the S&P has found resistance at the lower line of its two year bubble channel. Also, I inlaid a weekly candle chart at the corner of chart 5 that shows the S&P has resistance at the center basis line of the weekly Bollinger Bands®.

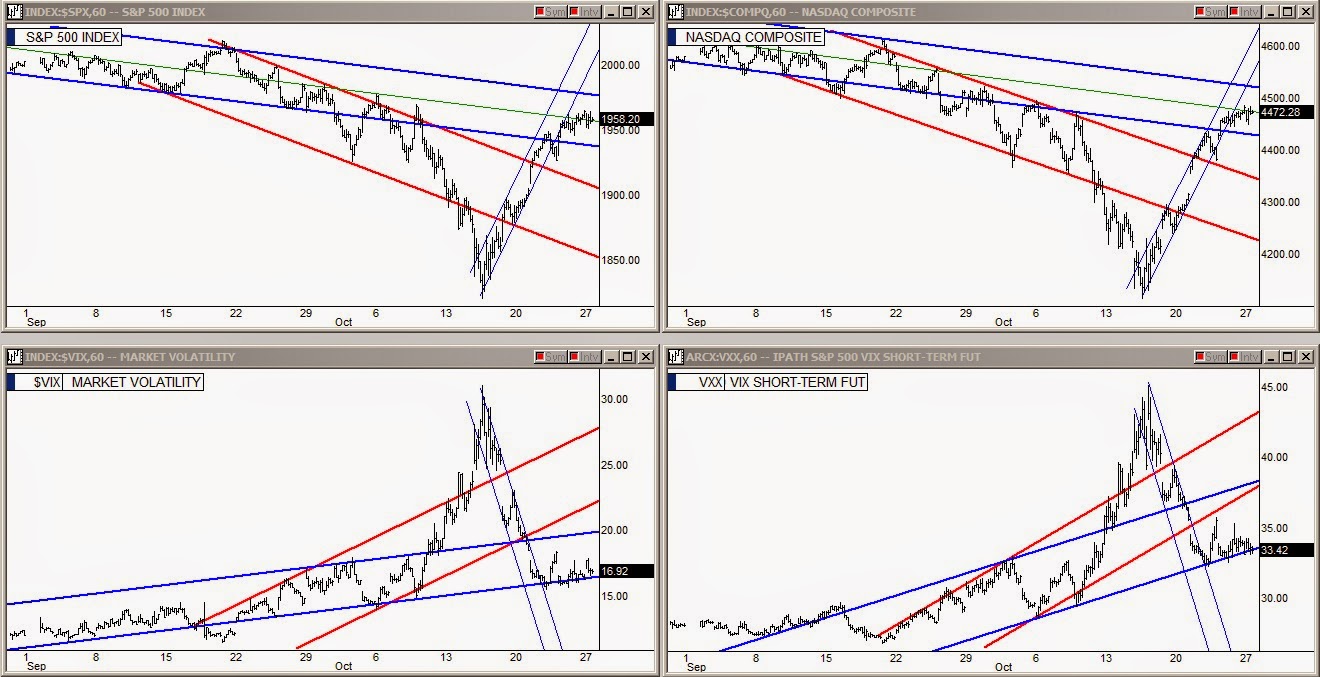
Looking at the third cluster above, the short term channels, we see the trading action is coming to a standstill as traders wait for the big EMA pivot situation on the S&P and VXX to resolve itself. Note, however, the VXX chart in the bottom right corner of the lowest cluster, where we can see that it dropped out of its blue channel about twenty-five minutes before the close Monday.
This could be a sign that the bears may be the first to blink in this standoff. My thoughts are that the bears are weary of these tight range tractor programs that are put on the market to control it when market conditions are critical. After seeing the tractor program complete two days of tight containment successfully, many of the shorts may begin to feel that even if Yellen turns off QE Wednesday as planned that they may have their tractor programs locked so tight on the market that it won't drop regardless of the selling pressure. These tractor programs are that strong and if traders see that stocks are not dropping in light of such a negative event then it follows that a short squeeze would be very easy to get started.
