The current level of exuberance is quite astonishing. Despite a variety of warning signs, the "recency bias" seems to be overwhelming more logical thought processes. It is also interesting to note that the general assumption is that the current economic backdrop is vibrant as evidenced by the slate of "better than expected" employment reports over the last year.
It is certainly easy to understand that view with the vast majority of "experts" on Wall Street and the media confirming the same. However, here are some observations I would like to share with you.
Observation 1: The Myth Of Bullish vs. Bearish
The market has finally, after six arduous years, broken out to new inflation-adjusted highs. That's awesome. It's fantastic. It's wonderful. After six years investors are finally making money. That is, of course, assuming that you didn't "panic sell" during the last major market decline.
Interestingly, this move to new highs is consistently trumpeted by the media as the reason investors should now be jumping into the markets which will assuredly go higher. However, isn't this really the opposite of the fundamental "buy low/sell high" premise of investing in the first place?
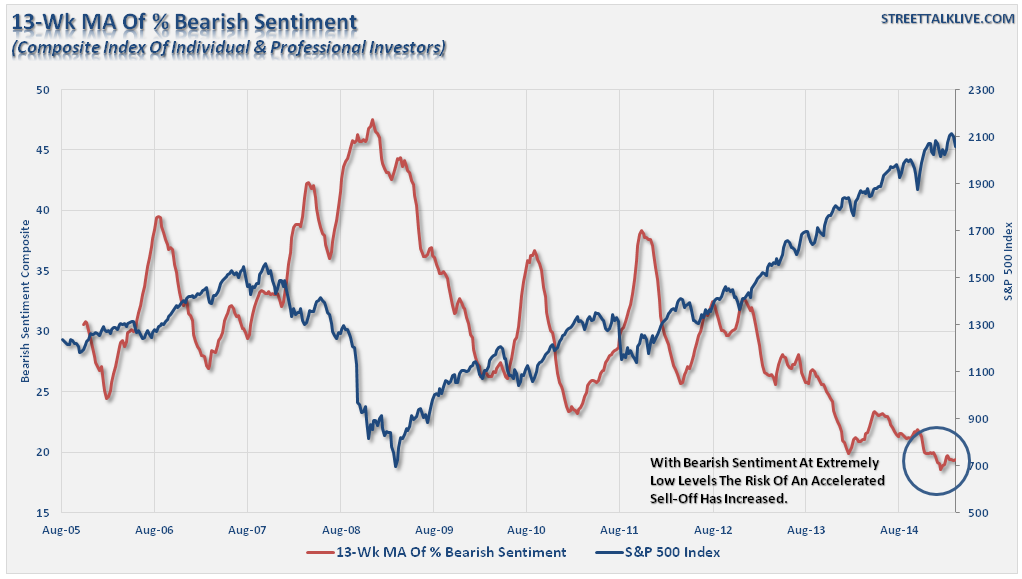
With "bullish optimism", as seen by many measures, reaching extreme levels, the risk to investors portfolios has risen markedly. However, if you disagree with the bullish view -- then you're bearish and, obviously, wrong. But then again, there really aren't many "bears" left as shown by the composite of professional and retail investor sentiment.
The argument of someone being bullish or bearish is complete nonsense. It is like two kids in a school yard pointing fingers at each other and calling names. The assumption by the media, and most individuals, is that if someone presents a non-bullish cash then that person is all in cash. The majority of the time, this isn't the case.
When markets are rising everybody is an investment genius. There was an article written a couple of years ago that suggested that a group of 100 monkeys' stock picks would outperform the majority of mutual funds and hedge funds. However, it is not rising markets that are my concern, that is the easy part. The hard part is analyzing the data as it develops to identify the risks that could lead to a catastrophic drawdown. In my view, spending six years getting back to "even" is not an effective retirement planning strategy.
Analyzing data for what is supportive of the current advance is not very useful. With portfolios fully allocated to market risk, bleating the same bullish commentary as everyone else is ineffective in managing portfolio risk. Therefore, digging into the data to discern why it is "not supportive" of the current market trend is much more useful in identifying the risks that will eventually lead to a reversion in the markets which set investors back years from their investment goals.
While much of my analysis is often considered bearish by the media, it isn't. I am quite bullish on the markets in the present. As I discussed yesterday, the current momentum of the market is positive which suggests that markets will continue to advance higher over the next month or so. However, giving you 10 reasons as to why the market might go higher from here, encouraging you to take on further speculative risk in your portfolio, isn't really helpful. What is more to your advantage is the analysis of why it may not. After all, "risk" is not about how much money you will make, but how much you will lose when you are wrong.
Observation 2: Markets Extremely Overbought
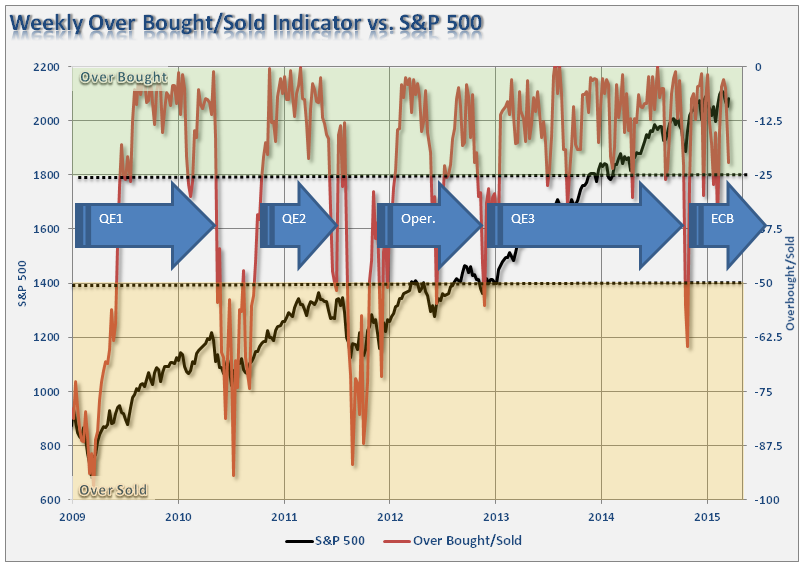
In the weekly newsletter, I regularly discuss the overbought, overbullish conditions currently present in the financial markets. The chart below is a measure of the market in the same vane.
The weekly chart of the S&P 500 clearly shows that the current advance has pushed the overbought/oversold indicator into an extreme overbought condition. However, this overbought condition has remained prevalent since the beginning of the Federal Reserve's QE-3 program with the exception of the rather sharp sell-off just prior to the ending of that program. Since then the market has regained its footing and returned to very overbought conditions once again on hopes that the ECB's version of QE will be just as effective at lifting asset prices as the Fed. As noted, since 2009, the markets have advanced into major overbought conditions during monetary intervention programs with corrections occurring in the absence of such support.
With the markets currently once again sporting overbought conditions, the question becomes what the catalyst will be that sends investors sprinting for cover?
- Rising turmoil from Greece as Germany pushes back against their anti-austerity measures.
- The Federal Reserve actually lifting interest rates further tightening monetary policy.
- A continued surge in the US dollar which further negatively impacts earnings.
- Further escalation of tensions with Russia and possible deployment of nuclear weapons.
- Further deterioration in U.S. economic data as a six-year-old economic recovery matures.
- Continued deceleration in China's economy.
- ECB's QE program fails to work as expected leaving markets devoid of expected liquidity.
- Another leg down in oil prices as storage issues become a problem.
Unfortunately, I don't have any idea which one it will be that eventually causes the markets to crack. In all likelihood, it will be something we haven't even considered yet. However, what I am absolutely sure of is that it will eventually happen. The only question is whether, or not, you will be paying attention to your portfolio when it does.
Observation 3: Economic Data Not Supporting Bullish Sentiment
While market sentiment remains very bullish, it is important to remember that the stock market "should" be a reflection of economic activity since it is organic economic activity that drives corporate earnings.
However, over much of the last quarter the underlying economic activity has shown significant deterioration along with corporate earnings as discussed Monday.
The point here is that much of the economic recovery that has been witnessed has coincided with the Fed's artificial interventions and other one-time effects (cash for houses, bailouts, etc.) that are not organic or sustainable.
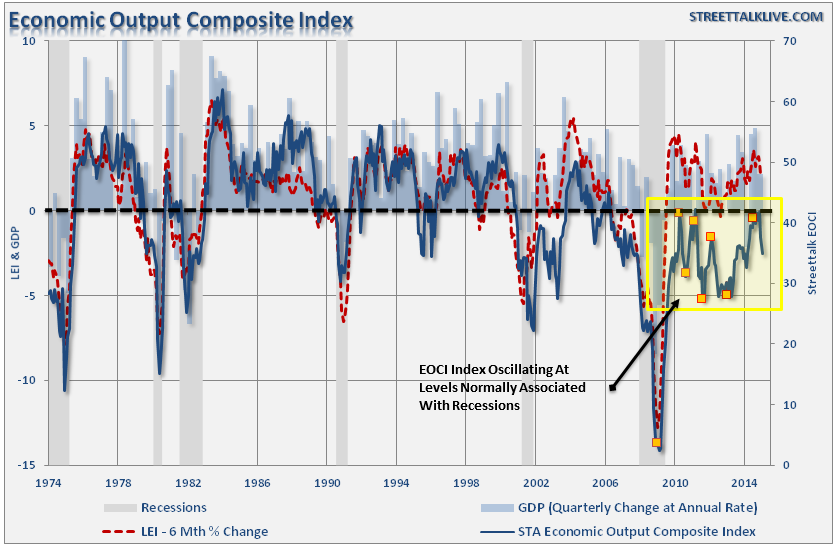
The chart below shows the Economic Output Composite Index. This index is comprised of the Chicago Fed National Activity Index, the ISM composite index, NFIB Small Business Survey, several of the major regional Fed Reserve manufacturing surveys, and the Chicago PMI. This is a very broad composite survey of economic activity across the country.
Currently, the index is operating at levels that have historically been associated with recessions. Importantly, the gold points represent the beginning and end of Federal Reserve interventions. Not surprisingly, economic activity has slowed since the Federal Reserve ended their last stimulative campaign. So, while "cold weather," which ironically happens every winter, is being blamed for a slowdown in economic activity, the data suggests that ex-stimulative measures real economic activity remains weak.
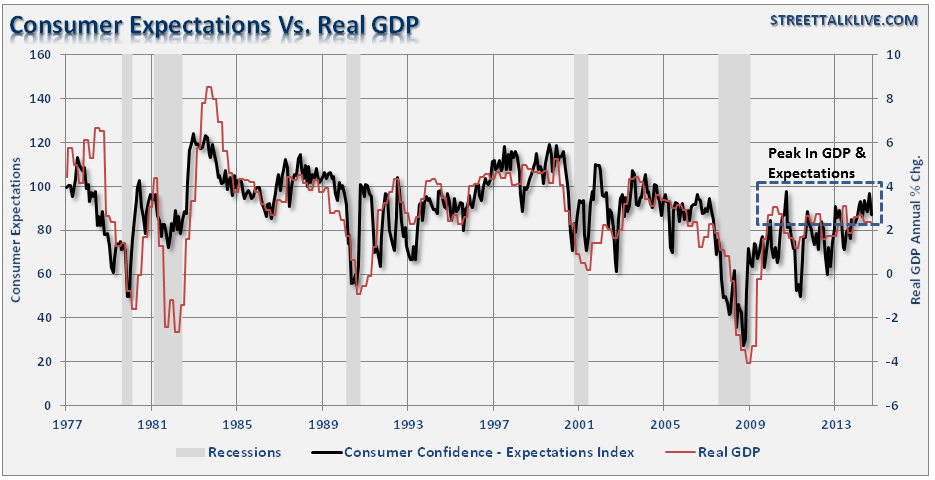
There is little evidence currently from this data that there is any substantial pickup in economic activity from the manufacturing side of the equation. However, with more than 70% of GDP driven by consumption, a look at the consumer may give us some further clues as well.
Despite the sharp rise in the market since December, consumer confidence has waned. More importantly, the impact of higher taxes and healthcare costs on already tightly constrained household finances, has cut confidence in their future outlook. This is important because the recent decline in future expectations historically leads the current confidence levels.
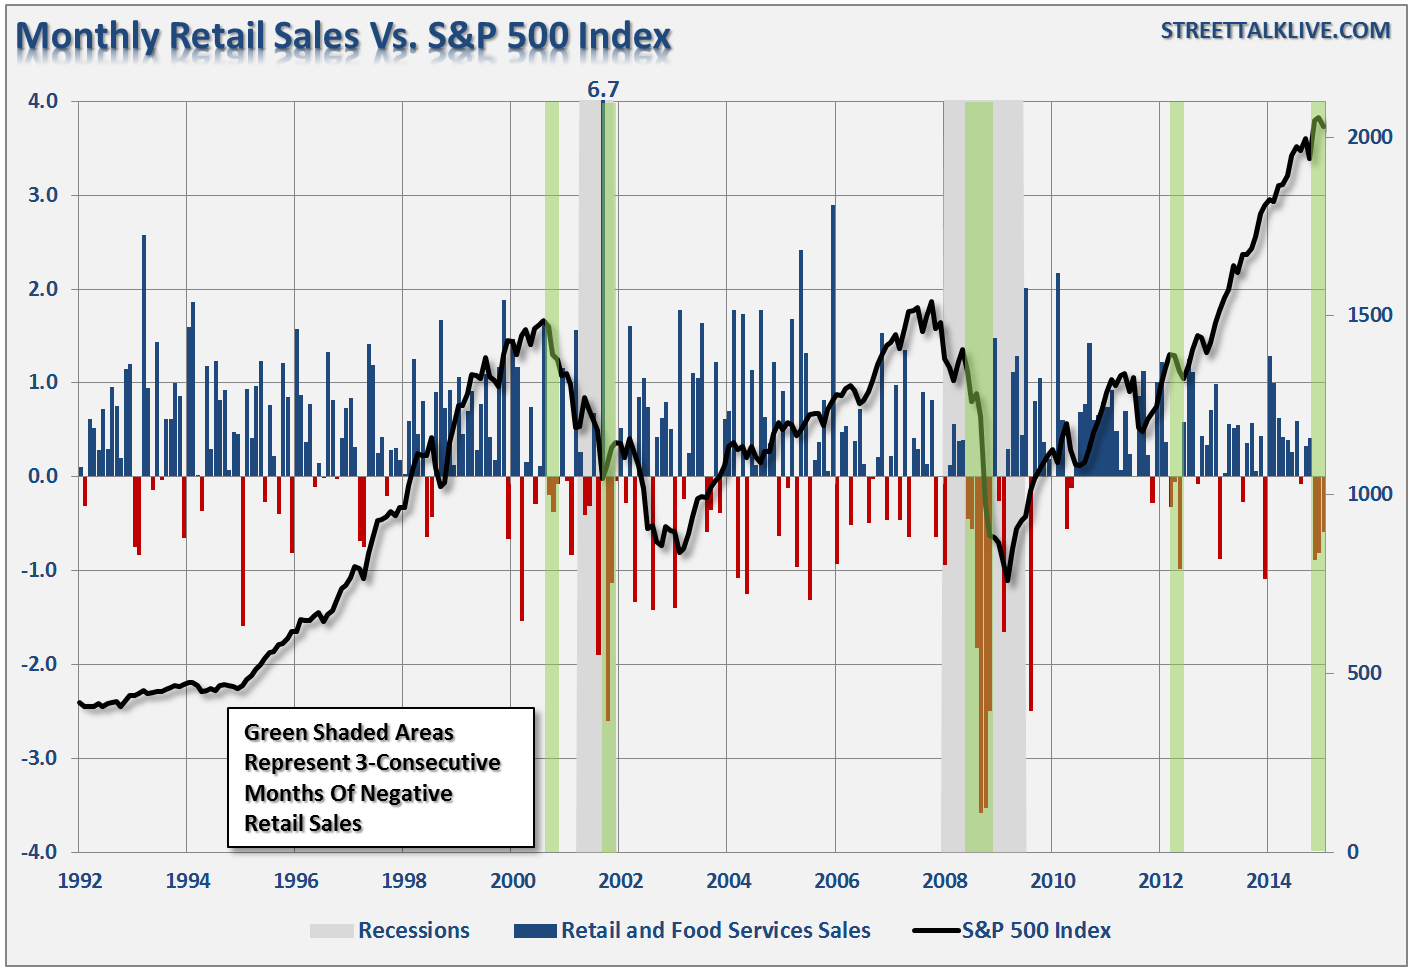
Consumption has also been reflected in the recent retail sales numbers which have been negative for three consecutive months in a row. As shown in the chart below this has only occurred four times previously.
While the media, economists, and analysts are currently pinning the majority of their investment outlooks on the back of a strengthening economy, currently, the evidence is not supportive of such hopes. One positive hope is that after several straight months of deterioration, the economy is due to bounce as a restocking cycle resumes going into the summer. However, those restocking cycles have tended to be short-lived as inventory builds do not tend to lead to sustainable economic growth.
Observation 4: Valuations Getting More Expensive By The Day
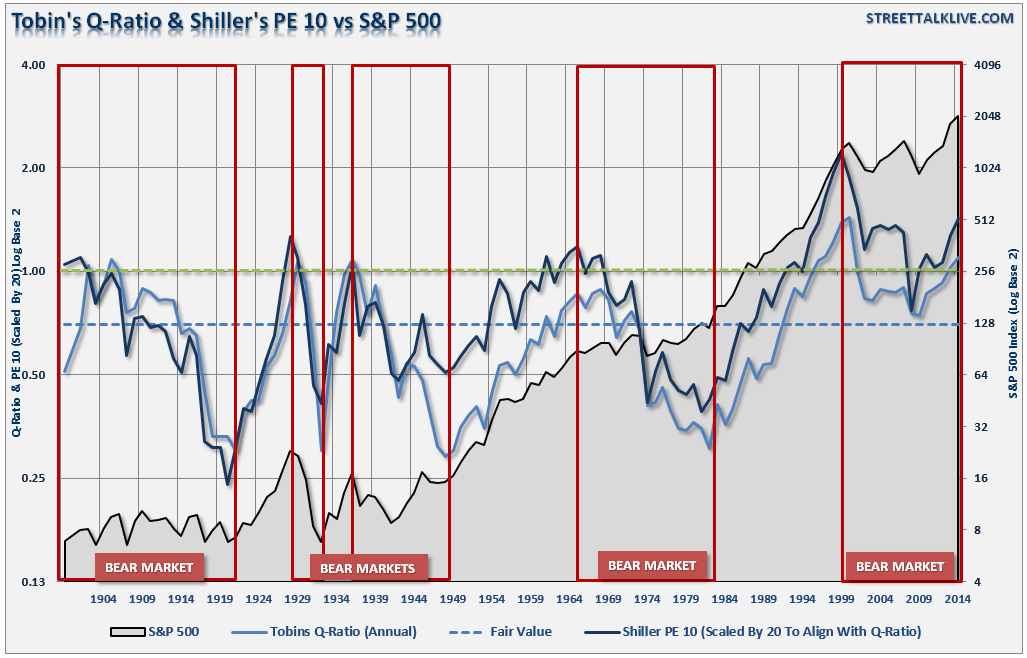
It is often stated that valuations are still cheap based on forward operating earnings. However, as the chart below shows, two primary measures of market valuations suggest that is not the case. The chart below shows Dr. Robert Shiller's cyclically adjusted P/E ratio combined with Tobin's Q-ratio. The problem is that current valuations only appear cheap when compared to the peak in 2000. Outside of that exception, the financial markets are now more expensive than at any other single point in history.
It is also worth noting that the average cyclical bull market has lasted about 3.8-years. The current bull market has now exceeded 6 years, which is competing for one of the longest stretches in history.
With a sub-par growth rate in the economy and a surging dollar putting pressure on profit margins, companies have resorted further into cost-cutting and stock buybacks to boost earnings. This strategy is finite and at some point the benefits from those measures come to an end.
The liquidity fueled cyclical bull rally that started in 2009 is very long in the tooth. I am not saying that the next major market crash is imminent but what I am suggesting is that the euphoria that is building in the markets is very reminiscent of previous major peaks in the markets. While markets can certainly remain irrational for much longer than most have ever thought - the current underpinnings of this rally remain very weak outside of the massive liquidity injections by the Federal Reserve.
Opportunities to participate in market rallies come along more often than taxi cabs in NYC. In the last 30 years, I have never seen the "boat leave dock" and never come back. The trick to long-term investing success is understanding there is no real benefit to being "bullish" or "bearish." There is simply the analysis of the risks that permanently impair your ability to retire. The financial markets, very much like a casino is Las Vegas, will eventually separate you from your money. If you blindly bet long enough against the house, you will lose. Successful investors, like professional gamblers, understand the risks and place their bets accordingly.
They also know when it's time to fold and go home.

