Get 40% Off
⚠ Earnings Alert! Which stocks are poised to surge?
See the stocks on our ProPicks radar. These strategies gained 19.7% year-to-date.
Unlock full list

Market Cycles: Timing In The Eye Of The Beholder

Published 03/12/2014, 12:51 AM
Updated 07/09/2023, 06:31 AM

My former Merrill Lynch colleague Walter Murphy tweeted the following yesterday:

Cycle Tweet

Walter is a highly experienced technical analyst and his tenure at Mother Merrill dates back to the days of Bob Farrell. His specialty is cycle analysis and Elliott Wave Theory, which is a topic that I never understood well because of the sensitivity of EW analysis to initial conditions.

20-week cycle validated?

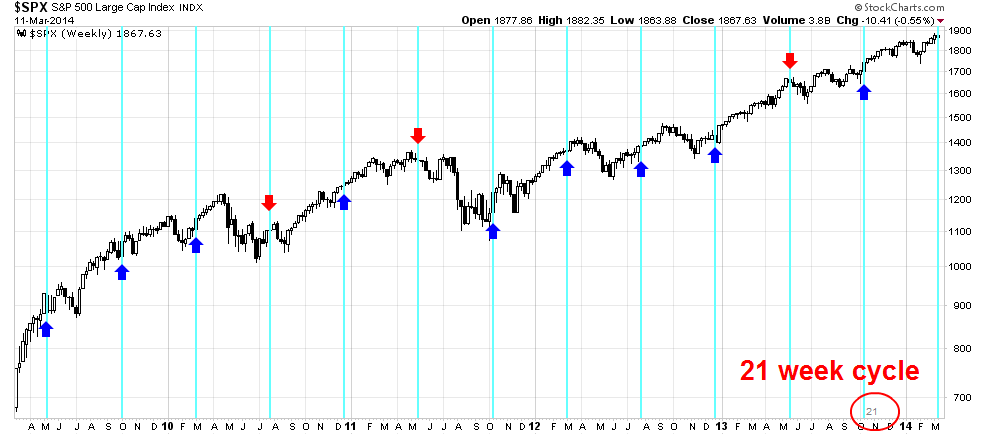
With the caveat that the market is affected by many cycles and the effects of  a cycle low or high may be overwhelmed by the effects of other cycles, I present below a five year chart of the SPX with a 21 week cycle (as per Walter's observation that the 20 week cycle lasts 21-22 weeks). The vertical lines are the 21-week "cycle lows"; the blue arrows represent "good" buying signals at each of those lows where there was little or no downside for the next 4-6 weeks; and the red arrows represent "bad" buying signals where the market went on to see significant downside for the next 4-6 weeks. As the chart shows, there are significantly more blue arrows representing "good" buying signals than red arrows indicating "bad" signals.

SPX Weekly, 5-Year Overview
I still don't understand cycle work well, but these results are intriguing. Walter's other cycle work appears to suggest a bullish bias based on another recent tweet:
Index Tweet

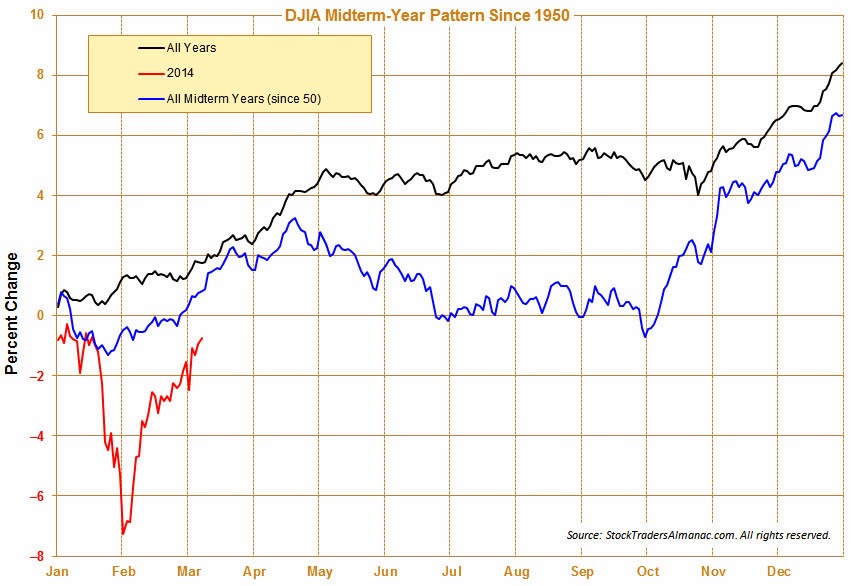
In addition, Christopher Mistal of Stock Trader's Almanac showed that we are moving into a seasonally bullish period for a mid-term election year:

DJIA Midterm-Year Pattern Since 1950
My own breadth studies (see What bad breadth?) suggest that, despite the overbought nature of the current equity market, stock prices can move higher. Walter's cycle analysis and Mistal's seasonal patterns are two other pieces of the mosaic that confirm that bullish view.

Disclosure: Cam Hui is a portfolio manager at Qwest Investment Fund Management Ltd. (“Qwest”). The opinions and any recommendations expressed in the blog are those of the author and do not reflect the opinions and recommendations of Qwest. Qwest reviews Mr. Hui’s blog to ensure it is connected with Mr. Hui’s obligation to deal fairly, honestly and in good faith with the blog’s readers.”

None of the information or opinions expressed in this blog constitutes a solicitation for the purchase or sale of any security or other instrument. Nothing in this blog constitutes investment advice and any recommendations that may be contained herein have not been based upon a consideration of the investment objectives, financial situation or particular needs of any specific recipient. Any purchase or sale activity in any securities or other instrument should be based upon your own analysis and conclusions. Past performance is not indicative of future results. Either Qwest or I may hold or control long or short positions in the securities or instruments mentioned.

Latest comments

Risk Disclosure: Trading in financial instruments and/or cryptocurrencies involves high risks including the risk of losing some, or all, of your investment amount, and may not be suitable for all investors. Prices of cryptocurrencies are extremely volatile and may be affected by external factors such as financial, regulatory or political events. Trading on margin increases the financial risks.
Before deciding to trade in financial instrument or cryptocurrencies you should be fully informed of the risks and costs associated with trading the financial markets, carefully consider your investment objectives, level of experience, and risk appetite, and seek professional advice where needed.
Fusion Media would like to remind you that the data contained in this website is not necessarily real-time nor accurate. The data and prices on the website are not necessarily provided by any market or exchange, but may be provided by market makers, and so prices may not be accurate and may differ from the actual price at any given market, meaning prices are indicative and not appropriate for trading purposes. Fusion Media and any provider of the data contained in this website will not accept liability for any loss or damage as a result of your trading, or your reliance on the information contained within this website.
It is prohibited to use, store, reproduce, display, modify, transmit or distribute the data contained in this website without the explicit prior written permission of Fusion Media and/or the data provider. All intellectual property rights are reserved by the providers and/or the exchange providing the data contained in this website.
Fusion Media may be compensated by the advertisers that appear on the website, based on your interaction with the advertisements or advertisers.
© 2007-2024 - Fusion Media Limited. All Rights Reserved.