Get 40% Off
🚨 Volatile Markets? Find Hidden Gems for Serious OutperformanceFind Stocks Now

Muni Bond Yields Still Beating Treasurys

Published 03/24/2016, 04:59 AM
Updated 05/14/2017, 06:45 AM

The municipal bond market had a good first quarter in 2016. Overall yields have declined, with the AAA scale declining across the yield spectrum. Muni yields, however, did not drop as much as Treasury yields did.

Dec 31, 2015 scales (Bloomberg)
Muni vs Treasury Yield Scale, December 31, 2015

Mar 18, 2016 scales (Bloomberg)
Muni vs Treasury Yield Scale, March 18, 2016

The municipal market is now a much better relative-value buy than it was at the close of 2015.

There was a decent drop in muni supply relative to last year. In the first half of 2015 we were in the middle of a supply glut due to the surge in refinancings. Refinancings have slowed down since then. In addition, the demand side picked up in the first quarter of 2016. There was the normal, year-end rollover demand from maturing bonds, called bonds, and coupon payments. However, the equity markets’ extreme volatility at the start of 2016 resulted in some asset reallocation into the bond market, also experienced by municipal bonds. The first six weeks of 2016 saw a rapid fall-off in tax-free yields before they turned up some this month.

The same forces pushed US Treasury yields down even further. Quantitative easing by both the European Central Bank and the Bank of Japan brought negative interest rates on the short end into the picture. We believe the tactics of these central banks helped pull Treasury yields to lower levels than would be in place if these forces were not at work. The drop in the oil price, from nearly $40 per barrel to below $30, also exerted downward pressure on Treasury yields.

So where do we go from here?

At Cumberland Advisors, we continue to emphasize a barbell approach to the markets, with concentrations of shorter and longer maturities. The AAA Bloomberg scale printed above does not reflect most deals that come to market at yields that are significantly higher than this scale. Still, there have been a number of issues that have come to market with AA ratings or higher and yields of 4%. This is a Muni/Treasury yield ratio of nearly 150%, and we are still embracing this mismatch.

As discussed in previous Cumberland Advisors commentaries, this type of yield is defensive because of the ratio, even though it is usually at least a 30-year maturity. As we eventually head back to the normalcy of a Federal Reserve hiking cycle (granted this hike cycle will be slower – maybe much slower – than past cycles), we believe the Muni market will return to longer-maturity yield ratios below 100%.

Take into account a top Federal marginal tax rate of 39.6% and the Obamacare tax of 3.8%. At those rates, a 4% tax-free yield is over 7% taxable equivalent, and even more if state taxes are taken into account.

We are a bit more concerned about inflation, going forward, than we have been in the past few years. A good part of this concern is due to the unwinding of the deflationary pressure caused by the drop in the oil price – along with the fall-off in capital expenditures tied to energy. From the current level, a rise in the price of oil from $30 to $40 is more than a 30% gain and will have implications for inflation. More important is that the labor participation rate has shown signs of bottoming out. (In other words, people out of work are increasingly looking for work.). Thus, the drop in unemployment below 5% is a very positive sign for the economy.

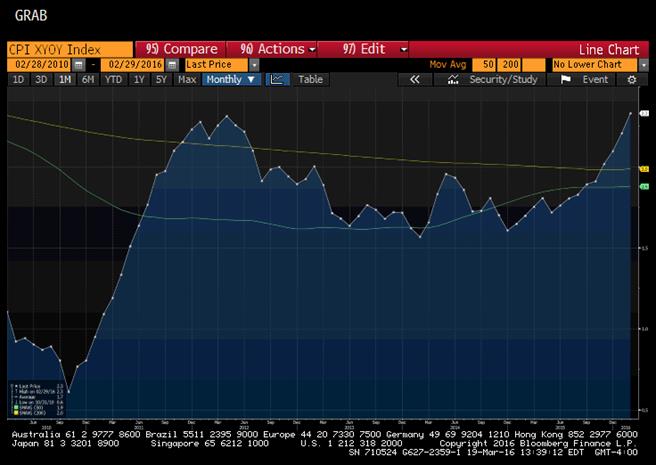
This employment pressure means that wage growth should start to seep over into the general inflation numbers. Core inflation (excluding food and energy) has stayed between 1.5% and 2% for over three years. However, it has recently broken above 2%, and we are watching it carefully. This core number (though it is not the preferred inflation measure of the Fed) does reflect a jump in services. Deflationary forces, which have seemingly been with us for years, are starting to appear in the rear-view mirror. Below is the graph for the Core Consumer Price Index (includes food and energy) for the trailing 12 months.

3rd party Ad. Not an offer or recommendation by Investing.com. See disclosure here or remove ads .
Core CPI
Core CPI YTD

From a strategic standpoint, pre-refunded bonds and inflation-indexed municipal bonds have a place in the shorter end of our muni strategy.

From a credit perspective, the well-documented woes of Puerto Rico and the ongoing pension issues in Chicago have masked the fact that there were more ratings upgrades than downgrades in the municipal market last year. Municipal issuers were net hirers of workers for the third year in a row. The wave of refinancings that were completed last year resulted in real savings for issuers that are impacting them positively and will continue to do so.

We expect to see more refinancings in 2016. As a result of the lower issuance numbers in 2016, we do not expect to see as many refundings as we saw in 2015. However, if the Muni/Treasury yield ratio drops, there may be more prerefundings of bonds due to less negative arbitrage (the difference between the muni yield of the refunding issue and the Treasury yields of the securities being used to escrow older bonds).

All-in-all, a decent first quarter for the muni market. We continue to watch developments in Puerto Rico and Chicago. In our view, the muni market still offers very decent value, especially in the intermediate and longer-maturity spectrums.

Latest comments

Risk Disclosure: Trading in financial instruments and/or cryptocurrencies involves high risks including the risk of losing some, or all, of your investment amount, and may not be suitable for all investors. Prices of cryptocurrencies are extremely volatile and may be affected by external factors such as financial, regulatory or political events. Trading on margin increases the financial risks.
Before deciding to trade in financial instrument or cryptocurrencies you should be fully informed of the risks and costs associated with trading the financial markets, carefully consider your investment objectives, level of experience, and risk appetite, and seek professional advice where needed.
Fusion Media would like to remind you that the data contained in this website is not necessarily real-time nor accurate. The data and prices on the website are not necessarily provided by any market or exchange, but may be provided by market makers, and so prices may not be accurate and may differ from the actual price at any given market, meaning prices are indicative and not appropriate for trading purposes. Fusion Media and any provider of the data contained in this website will not accept liability for any loss or damage as a result of your trading, or your reliance on the information contained within this website.
It is prohibited to use, store, reproduce, display, modify, transmit or distribute the data contained in this website without the explicit prior written permission of Fusion Media and/or the data provider. All intellectual property rights are reserved by the providers and/or the exchange providing the data contained in this website.
Fusion Media may be compensated by the advertisers that appear on the website, based on your interaction with the advertisements or advertisers.
© 2007-2024 - Fusion Media Limited. All Rights Reserved.