- Nasdaq broke down after fewer & fewer stocks made new highs
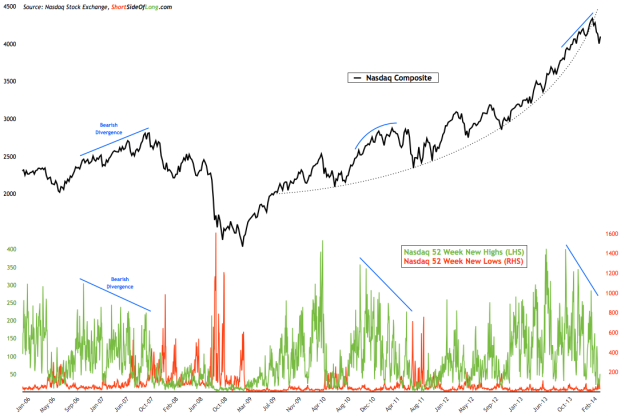
The recent NYSE 52 Week New Highs & Lows data continues to show bearish divergence discussed last month. However, some of the market participants do not like following NYSE breadth data as it holds a large number of non-company issues. Therefore, from time to time I will also focus on Nasdaq stock-exchange data, as seen in the chart above.
During the recent rally into October 2013 Nasdaq posted 388 new highs. As the tech heavy index moved even higher into December 2013, number of new highs failed to expand with the readings falling to 326. Finally, as the index peaked in price around March of this year, it coincided with yet an even lower reading of 273 new highs. As the chart clearly shows, Nasdaq’s exponential rise was not going to be sustainable without a continuous expansion of new highs. Now that the correction has started, it is important to watch readings of new lows.
- Bearish breadth divergence isn’t only seen in 52 week highs
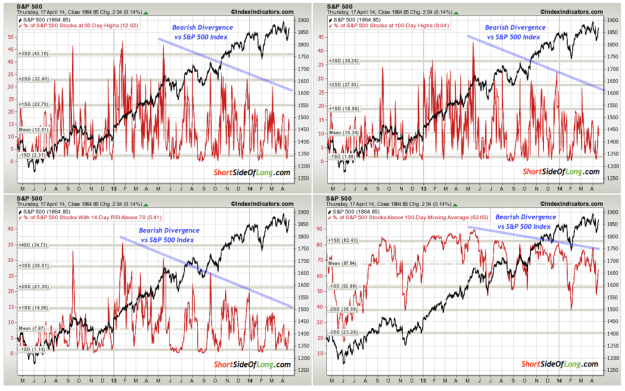
Source: index indicators (edited by Short Side of Long)
Similar to last month, I would like to point out that bearish divergence patterns aren’t just seen in the 52 week new high readings. The chart above makes an observation that despite S&P 500′s continuous rise towards record highs, there are variety of indicators warning us that the current rally isn’t sustainable in the long run. These include percentage of stocks at 50 day new highs, 100 day new highs, number of stocks with RSI at 70 (overbought) and finally the percentage of stocks trading above 100 day moving average.
Interestingly, the majority of these divergences started around May 2013, just as interest rates began to rise. In other words, rising interest rates are putting pressure on the economy and various companies. As more companies enter downtrends, the market itself could eventually turn down too.
- AD Line shows market has not been oversold since September
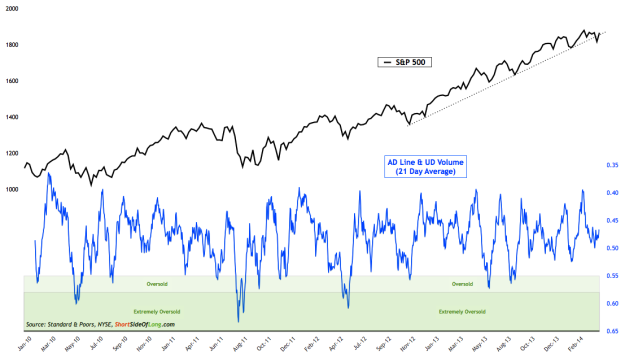
Refocusing our attention back to NYSE breadth readings, the chart above looks at advances vs declines averaged together with up vs down volume numbers. With recent readings right around neutral territory and market still in an uptrend, we have no major clues right now.
It is worth noting that this indicator has done a great job signalling lows during the recent bull market and other previous uptrends. As we can see from Chart 3, whenever AD / UD line became oversold, market was right at or close to an intermediate bottom. On the other hand, overbought readings aren’t as useful during uptrends, but become more relevant during downtrends and bear markets as seen during 2007-09 period.
Finally, the investor favourite -- cumulative NYSE Advance Decline Line -- still continues to rise towards new highs. Various technical analysts would claim this is a bullish omen and predicts further gains in the current overly aged bull market.
- According to stocks above 200 MA, market is still overbought…
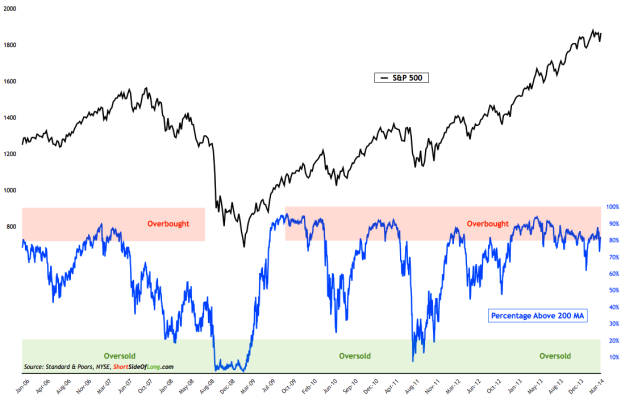
Percentage of stocks trading above various moving averages has not changed much since the last report. Most importantly, the chart above shows that percentage of stocks above 200 day moving average still sits in overbought territory, as it has done so since late 2012. The question is, how long can the index stay overbought before a mean reversion? Let me remind you that the last time we saw oversold conditions were around November 2011.
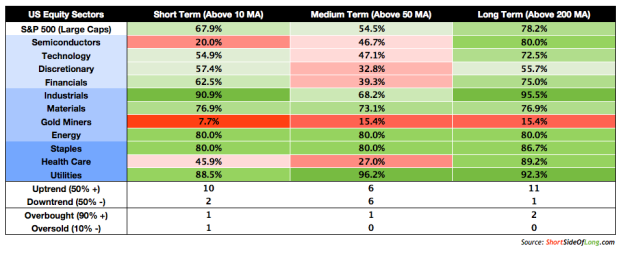
The breadth strength is coming from the Industrials, Health Care and Utilities sectors where 95.5%, 89.2% and 92.3% of components are above their 200 day MAs respectively. On the other hand, weak sectors are currently cyclicals like Discretionary and Technology with 55.7% and 72.5% of stocks above 200 MA respectively.
Finally, Gold Miners remain in the depths of a bear market with only 15.4% of the sector components above their respective 200 MAs. This sector has been extremely oversold for a long time now and has experienced three annual losses in the row.
- Gold miners continue to be the weakest sector in the S&P 500

