Russia defense of RUB likely to be insufficient Russia shocked the markets by hiking rates dramatically in the middle of their night Monday. Just before 1 AM in Moscow, the central bank raised rates from 10.5% to 17.0%, the largest hike since the collapse of the Russian bond market in 1998. The move highlights the conundrum that Russia finds itself in. With money fleeing the country, the banking system is in danger of collapse. The plunge in the currency threatens to raise the inflation rate (already around 9%) to intolerable levels. Moreover, companies that had borrowed money in foreign currencies are in serious trouble. The hike in rates is meant to make holding RUB more attractive and thereby stop the depreciation. Unfortunately, this strategy is more successful when the problem is foreign speculators borrowing a currency to short it. In Russia’s case, when domestic capital flight is the problem, the rise in rates might only make things worse by spreading the pain to domestic borrowers and causing the economy to contract. That will make stocks, real estate and other RUB-denominated assets less attractive. I believe it will take more than a hike in rates to stabilize the currency. A bottom to oil prices and some resolution of the tensions with the West over Ukraine are necessary before capital will be attracted back into the country, in my view. Unfortunately, both those targets remain far away.
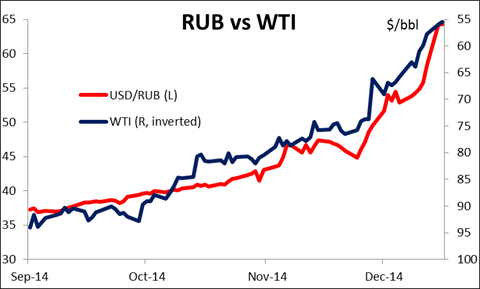
Yesterday’s brief bounce in oil didn’t last long. Oil futures fell as much as 1.2% in New York yesterday with no particular trigger, just a continuation of the recent fall. Our technical analysis concludes that the overall path remains to the downside. See the technical section for more details.
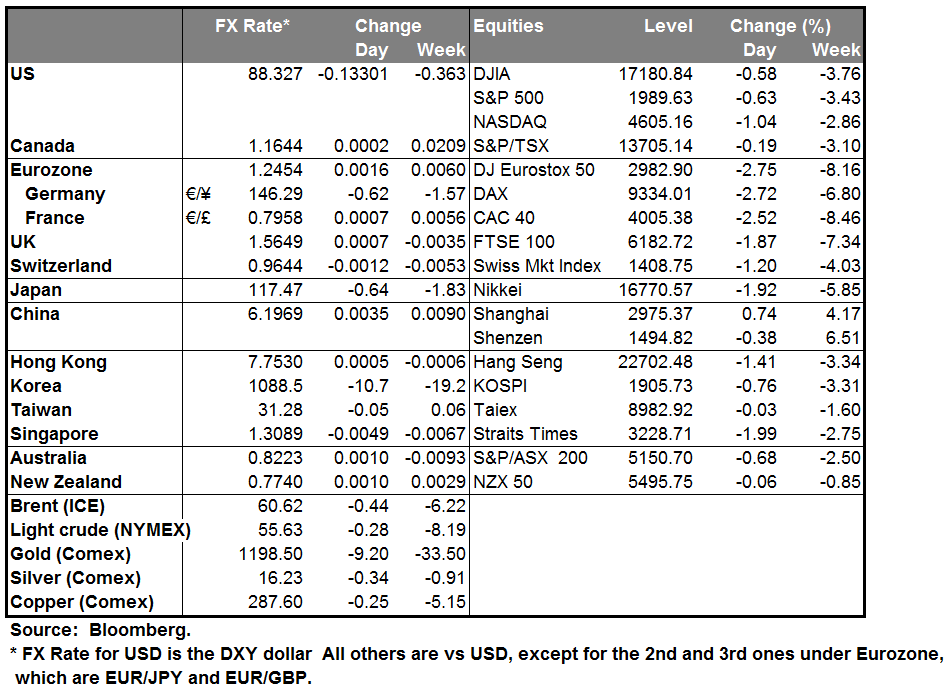
As might be expected, the currencies of oil producers are generally suffering – RUB, BRL and IDR – while oil importers are generally benefiting – KRW, SGD, and TWD. A long/short basket of EM currencies based on whether the country is an oil importer or exporter could be rewarding, although many of these currencies are not accessible to the retail investor.
Nonetheless, the impact of lower oil prices on EM currencies is not entirely consistent. TRY fell to a record low yesterday while MXN was little changed. TRY is apparently suffering from political risk as President Erdogan moved against journalists and other perceived enemies. Even though Turkish assets have been among the top performers in EM as the collapse in oil prices ameliorates some of Turkey’s balance-of-payments problems, investors are not likely to give the government the benefit of the doubt in the current risk-off environment. And while the MXN may have been fairly stable yesterday, the Mexican stock market fell the most of any major stock market yesterday, so clearly the fall in oil prices is being reflected in MXN-denominated assets. I don’t think the worst is over for the peso yet.
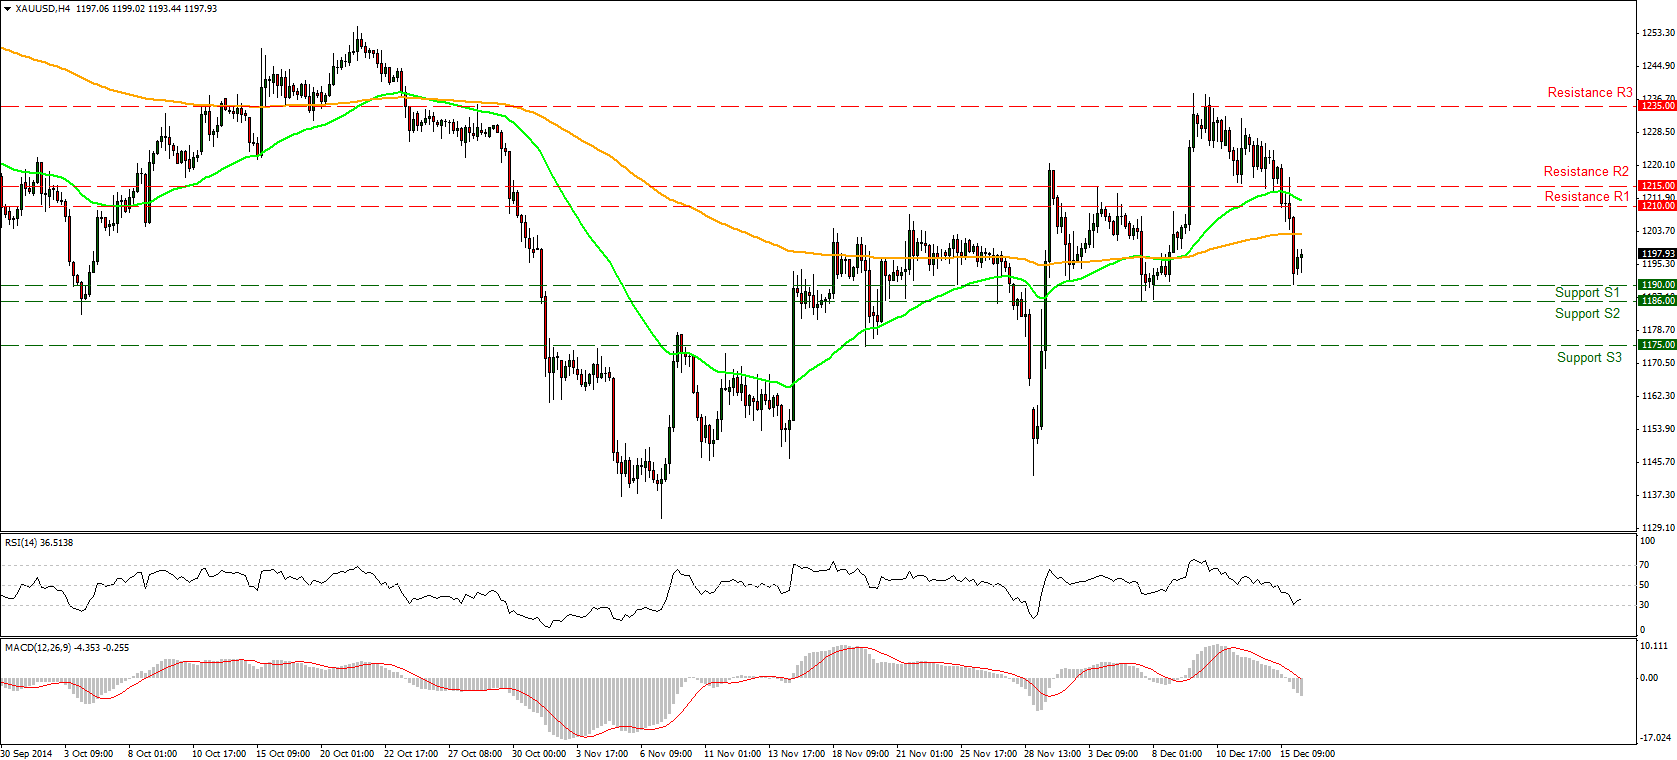
Surprisingly, gold and silver both fell sharply despite the increasing volatility. It appears that they are trading more like commodities than investment vehicles. True, the need for an inflation hedge is diminishing, but one might expect the need for a safe haven asset to increase – that’s why JPY was the best-performing currency overnight. The inability of gold to perform in this environment shows that it is losing a lot of its allure.
The minutes from the latest RBA policy meeting showed that the board discussed why the market is pricing in the possibility of a rate cut. That could be the beginning of a deeper consideration of the possibility, which would be a negative for the currency. Also, the board once again repeated that AUD is “above most estimates of its fundamental value…” AUD weakened as a result, including against NZD.
Today’s market: Today is PMI day. In China, the preliminary HSBC manufacturing PMI for December fell further into contractionary territory than was expected. With China accounting for around 11% of global oil demand, slowing Chinese growth is of course another negative for oil prices. We also get the preliminary manufacturing and service-sector PMI data from several European countries and the Eurozone as a whole. Those are expected to have risen, which could boost the euro. The German ZEW survey for December may also be EUR-positive. Both indices are forecast to have risen. After last month’s surge, a rise in the expectations index could be a sign that the German economy may have started to stabilize and could strengthen the euro somewhat.
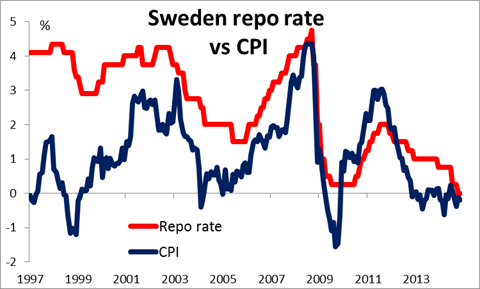
During the European day, the spotlight will be on the Riksbank policy rate decision. Last Thursday’s CPI for November showed that the country remains in deflation, which reinforces our view that the Riksbank will move towards unconventional measures, perhaps even at this meeting. Riksbank Governor Stefan Ingves will hold a press conference following the rate decision.
In the UK, the CPI for November is expected to slow to 1.2% yoy from 1.3% yoy, which could push further back the expectations for BoE tightening and leave the pound vulnerable. BoE Governor Mark Carney holds a press conference following the release of the Financial Stability Review.
In the US, we get housing starts and building permits, both for November. Starts are expected to be higher but permits lower. The preliminary Markit manufacturing PMI for December is also due out.
The Market
EUR/USD finds support near 1.2410
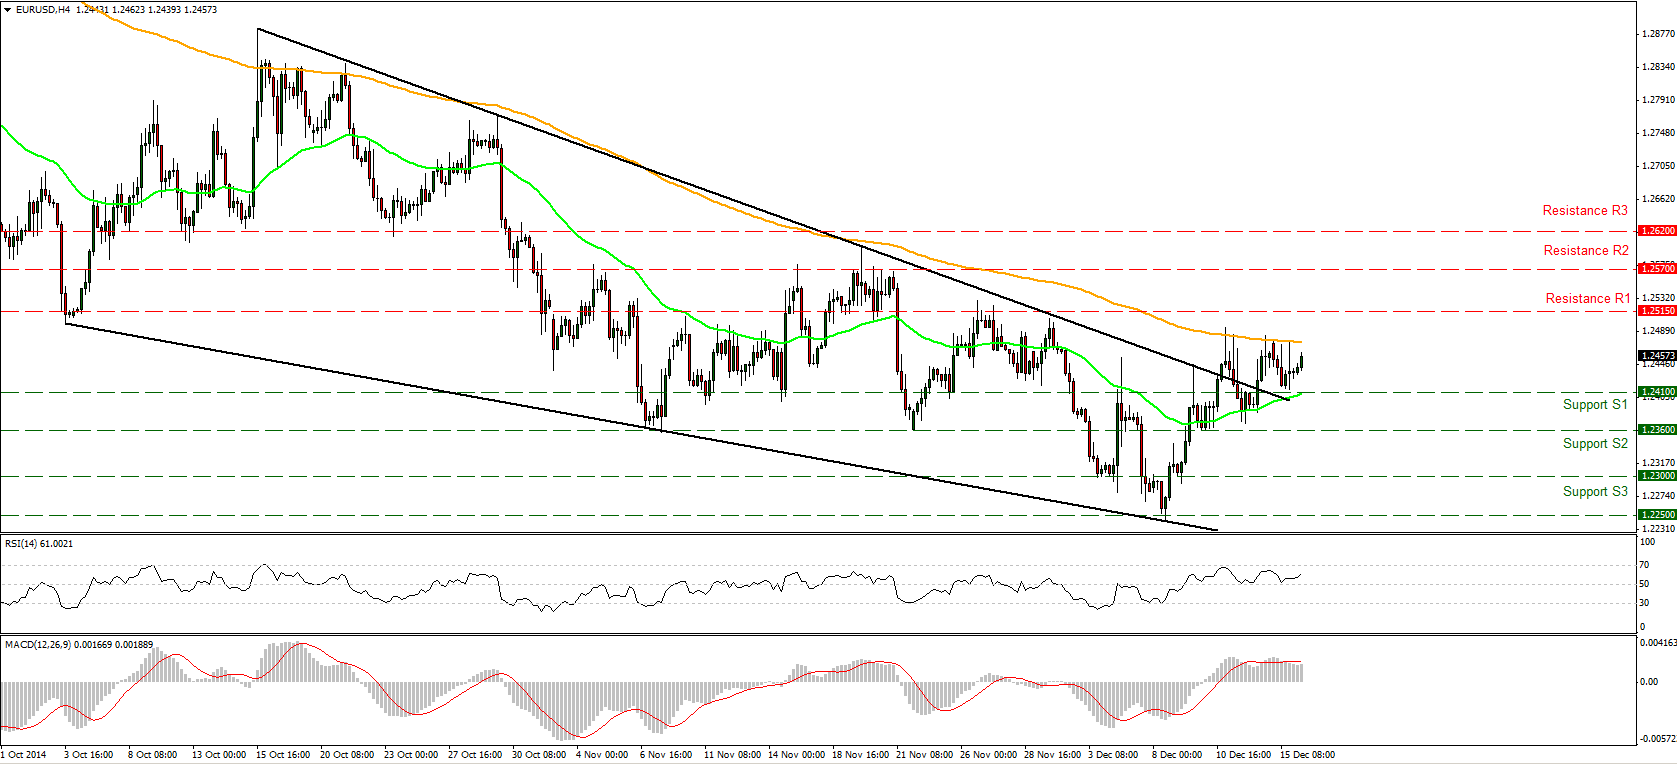
EUR/USD moved higher after finding support near 1.2410 (S1) line. However, the move was topped by the 200-period moving average, which has proved a good resistance to the price action recently. I would expect a break above the 200-period moving average to trigger further extensions towards our 1.2515 (R1) resistance hurdle. On the other hand, a break below 1.2410 (S1) is necessary for a leg down towards the well-tested support line of 1.2360 (S2). On the daily chart, the rate is still printing lower peaks and lower troughs below both the 50- and the 200- day moving averages and this keeps the overall path to the downside. The positive divergence between the daily momentum studies and the price action is still intact, which indicates that the longer-term downtrend is losing momentum, allowing EUR to trade correctively higher.
• Support: 1.2410 (S1), 1.2360 (S2), 1.2300 (S3).
• Resistance: 1.2515 (R1), 1.2570 (R2), 1.2620 (R3).
USD/JPY test the 117.35 support line
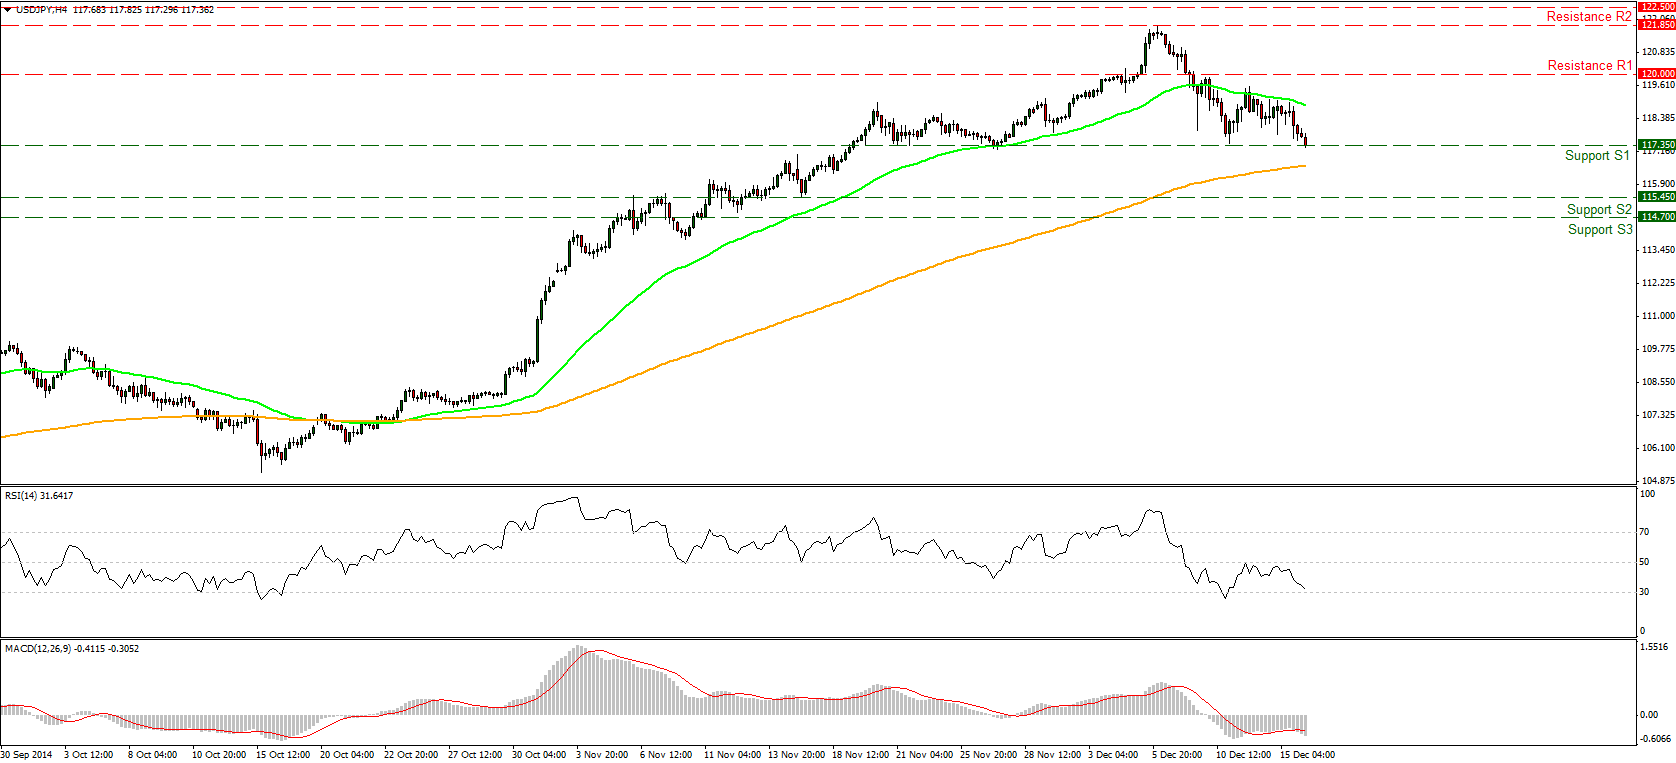
USD/JPY declined on Monday but remained within the 120.00 (R1) resistance and 117.35 (S1) support line. During the early European hours, the pair is testing the 117.35 (S1) support hurdle where a break below could push the rate to our next support of 115.45 (S2). Looking at our short-term momentum signals, the RSI is heading towards the 30 line, while the MACD, already in its negative territory, crossed below its trigger. Although these signs designate accelerating bearish momentum, I would wait for a clear break below the support of 117.35 (S1) to get confident for further downside corrective moves. As for the broader trend, the price structure is still higher highs and higher lows above both the 50- and the 200-day moving averages and this keeps the overall path of the pair to the upside. Therefore, I would consider the recent setback or any extensions of it as a correction of the longer-term uptrend.
• Support: 117.35 (S1), 115.45 (S2), 114.00 (S3) .
• Resistance: 120.00 (R1), 121.85 (R2), 122.50 (R3).
GBP/USD dipped below 1.5665
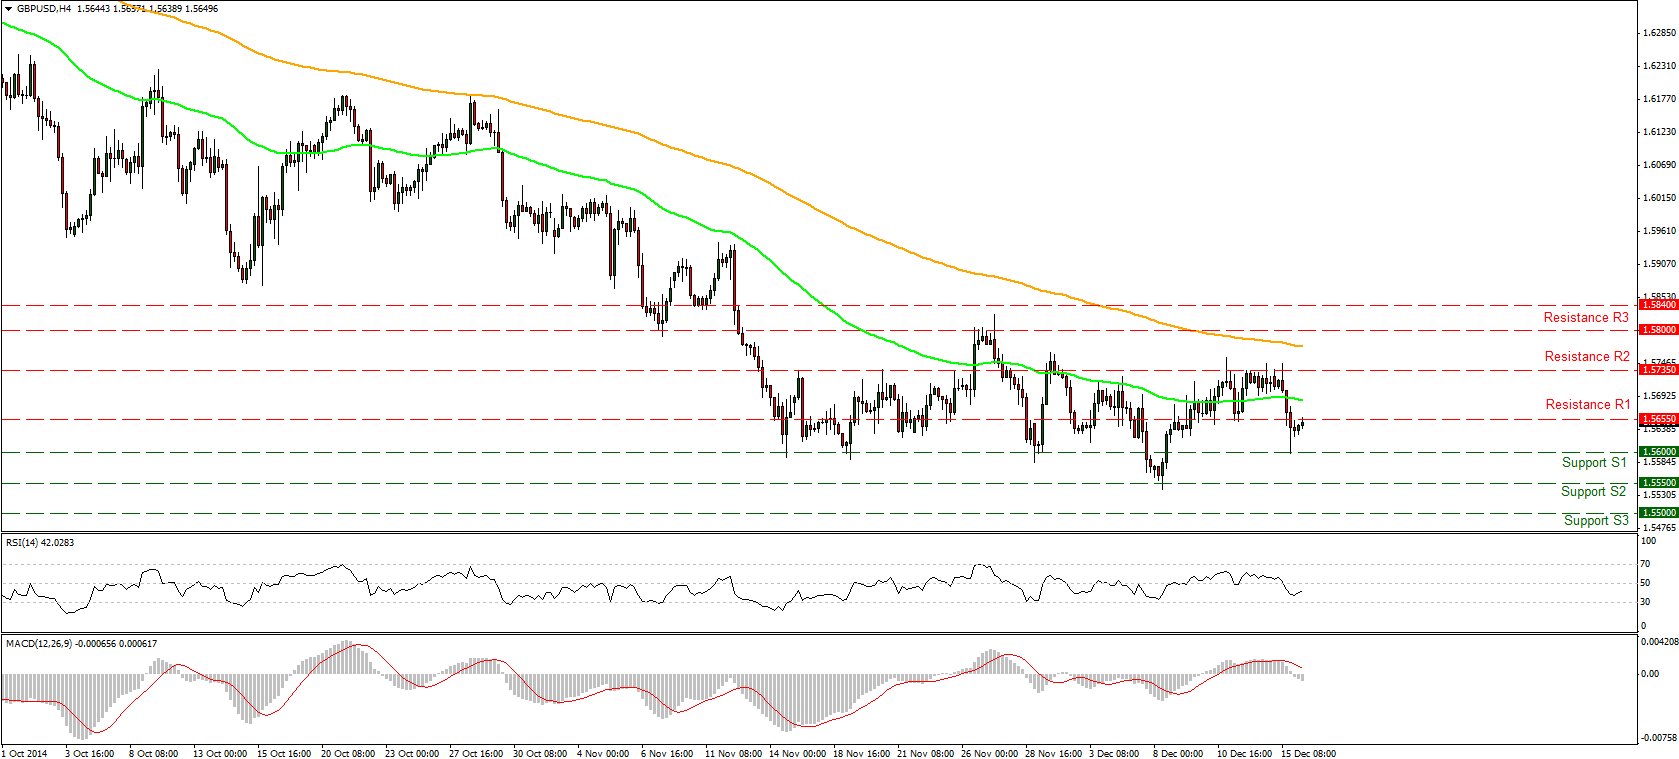
GBP/USD declined sharply on Monday, breaking our support-turned-into resistance line of 1.5655 (R1) but bounced back to trade around that level again. With no clear trending direction in the short-term time frames, I would wait for today’s CPI rate and banks stress-test results to print a better technical picture. On the daily chart, I maintain the view that as long as Cable is trading below the 80-day exponential moving average, the overall path is negative.
• Support: 1.5600 (S1), 1.5550 (S2), 1.5500 (S3).
• Resistance: 1.5655 (R1), 1.5735 (R2), 1.5800 (R3).
WTI below 56.00
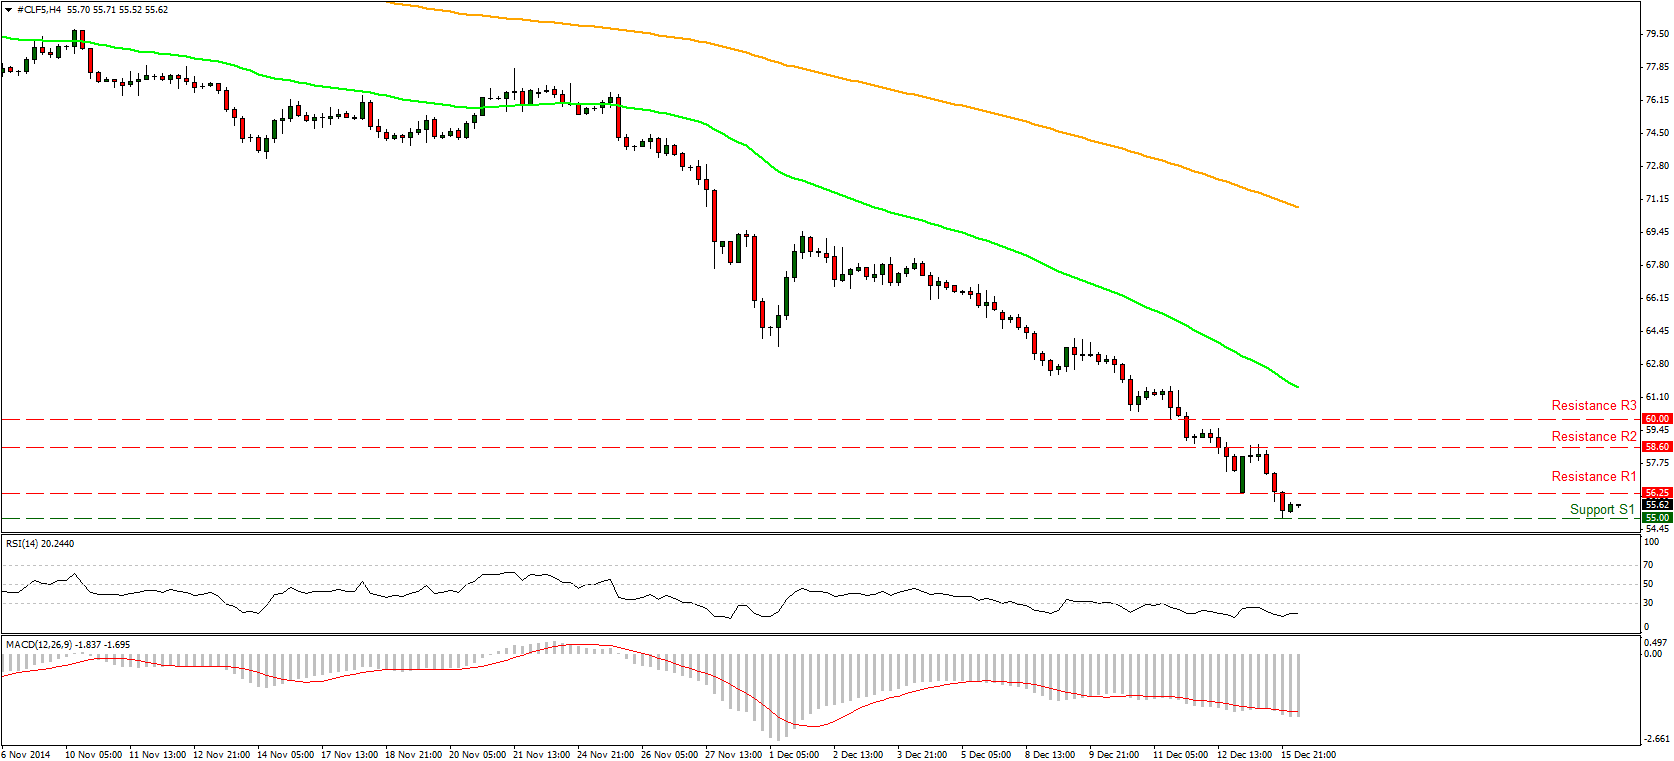
WTI plunged on Monday, breaking below the support-turned-into-resistance 56.25 (R1) level. The decline was stopped at 55.00 (S1) support line. A break below that line could push the price even lower perhaps towards our next support of 53.80 (S2) defined by the lows of 30th January 2007. In the bigger picture the overall path remains to the downside and our daily technical studies support this notion. Both the 50- and the 200-day moving averages remain above the price structure and their slope stays to the downside. The 14-day RSI remains within its oversold territory, while the daily MACD, already at extreme low levels, stands below its trigger line pointing down. These momentum signals designate strong downside momentum and reinforce the case that we are likely to see even lower oil prices in the near future.
• Support: 55.00 (S1), 53.80 (S2), 52.60 (S3).
• Resistance: 56.25 (R1), 58.60 (R2), 60.00 (R3).
Gold break two support lines in a row
Gold plunged on Monday, breaking two support lines in a row. The precious metal found support near the 1190 (S1) area where it remained elevated during the early European hours. Looking at our short-term momentum signals, the RSI found support at its 30 line and moved up, while the MACD fell into its negative territory. Although a test of the 1210 (R1) resistance hurdle seems possible, these mixed momentum signs give me enough reasons to adopt a neutral stance.
• Support: 1190 (S1), 1186 (S2), 1175 (S3).
• Resistance: 1210 (R1), 1215 (R2), 1235 (R3).

