EUR/USD salutes the new year by mimicking it EUR/USD saluted the New Year 2015 by mimicking it – hitting 1.2015 (and even a bit lower) and then gapping lower at the opening Monday. ECB President Draghi was quoted in the German paper Handelsblatt Friday as saying that the risk that the ECB doesn’t fulfill its mandate of price stability is higher than it was six months ago and that they are “in technical preparations” to institute quantitative easing early in 2015 if necessary.
The first part of his statement is obviously true; all you have to do is wait for this Wednesday, when the eurozone CPI for December is forecast to go into deflation (-0.1%) as opposed to +0.5% back in June. Even that figure was well below their 2% target, though. The second part though depends on getting agreement on the ECB board. As mentioned on Friday, not everyone on the board agrees (even though Draghi said the Board was “unanimous”) and furthermore, the Greek elections may prove a legal obstacle to instituting QE in January and perhaps later as well.
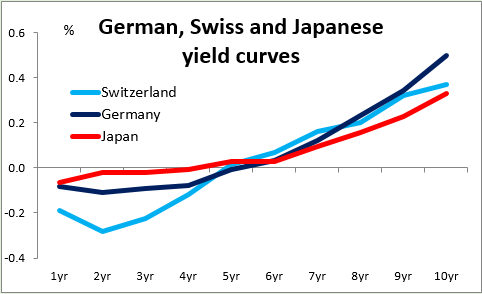
Draghi’s comments not only pushed EUR/USD down to right above the psychological line of 1.2000, but also pushed eurozone bond yields, already at record lows, down further. German bond yields for example are now negative out to 5-Year and 10-Year went below 50 bps for the first time. There’s now not so much difference overall between German yields and Japanese yields. Does this presage Japanese-style deflation and therefore Japanese-style monetary policy in the eurozone? It might, eventually. In any case, if they do not institute QE, then there is likely to be a big sell-off in eurozone bonds and repatriation of currency that would push EUR/USD even lower.
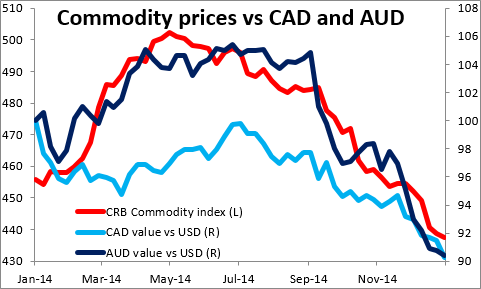
Commodities were pushed lower by the strong dollar as well, and with them the commodity currencies fell. USD/CAD hit a new high for this cycle. Lower commodity prices resulting from Draghi’s warning about the risks of low inflation seems like a self-fulfilling prophecy, even more so as the US 5yr/5yr forward inflation swap fell further. His concern that inflation expectations are becoming unanchored seems to be one of the reasons why inflation expectations are becoming unanchored. As inflation expectations fell, so too did expectations for the Fed funds rate, despite comments from Cleveland Fed President Loretta Mester that she “could imagine interest rates going up in the first half of the year.”
In fact the US dollar gained against all the G10 currencies and most of the EM currencies that we track. The US currency regained parity vs CHF as the Swiss National Bank was apparently forced to intervene to defend the EUR/CHF floor. Swiss bond yields are now negative out to four years and the 10-year yield is about the same as in Japan.
One indication of where the currency markets may be headed this year: despite all the talk about the erosion of the dollar’s standing in the world financial system, the IMF Friday announced that the US currency’s share of global foreign exchange reserves rose to 62.3% in Q3 last year from 60.7% in Q2. This was the highest level since Q4 2011. The euro’s share on the other hand fell to 22.6% from 24.1%, its lowest level in over a decade. That means central banks chose not to rebalance their falling reserves as the euro fell during the quarter. These folks are the closest there are to having inside information in the FX market so we should take their views seriously. Talk of the dollar’s demise is premature.
Today’s highlights: On Monday, the main release will be the German preliminary CPI for December. As usual, several of the lander release their data before the national figure and the market looks at the larger ones for guidance. The consensus is for a fall in the national yoy rate to +0.2% from +0.5%, which could prove EUR-negative.
In the UK, the construction PMI is forecast is estimated to have declined in December.
As for the speakers, Minneapolis Fed President Kocherlakota spoke in Boston on Sunday and argued against requiring the Fed to use a mathematical rule to set policy. Republicans are considering introducing rules that would limit the Fed’s independence and room for discretion in setting monetary policy. Also Boston Fed President Rosengren released the text of a speech he will make later in the day in which he said low core inflation and wage growth “provide ample justification for patience,” but he doesn’t vote this year so what does it matter? During the European day, San Francisco Fed President John Williams participates at a panel on “Housing, Unemployment, and Monetary Policy”. Norges Bank Governor Oeystein Olsen and Swiss National Bank President Thomas Jordan will also speak.
Rest of the week: Tuesday we get the final PMIs for December. In the US, the ISM non-manufacturing index is forecast to have declined, following the disappointing manufacturing ISM on Friday. The US factory orders for November are also coming out.
On Wednesday, besides eurozone’s CPI data, the Fed releases the minutes from its latest policy meeting, when officials dropped the “considerable period” phrase and instead said the Committee “can be patient in beginning to normalize the stance of monetary policy.” The market is likely to look into the minutes for more insights regarding the meaning of the new phrase. The ADP employment for December is also coming out two days ahead of the NFP release and is expected to show a faster rate of growth in jobs.
On Thursday, the Bank of England Monetary Policy Committee meets. It’s unlikely to change policy and therefore the impact on the market should be minimal as usual. The minutes of the meeting however should make interesting reading when they are released on 21st of January. Eurozone’s PPI and retail sales both for November are also coming out.
Finally, on Friday, the major event will be the US non-farm payrolls for December. The market consensus is for an increase in payrolls of 240k, down from the stunning print of 321k in November but still strong. That would show that the economy has added at least 200k jobs for 11 consecutive months and could result the biggest annual gain in employment since 1999. The unemployment rate is forecast to have declined to 5.7% from 5.8%, while average hourly earnings are expected to accelerate on a yoy basis. Such a strong employment report could push Fed funds rate expectations up and therefore support the dollar. Canada’s unemployment rate for December is also coming out.
The Market
EUR/USD tumbles below 1.2000
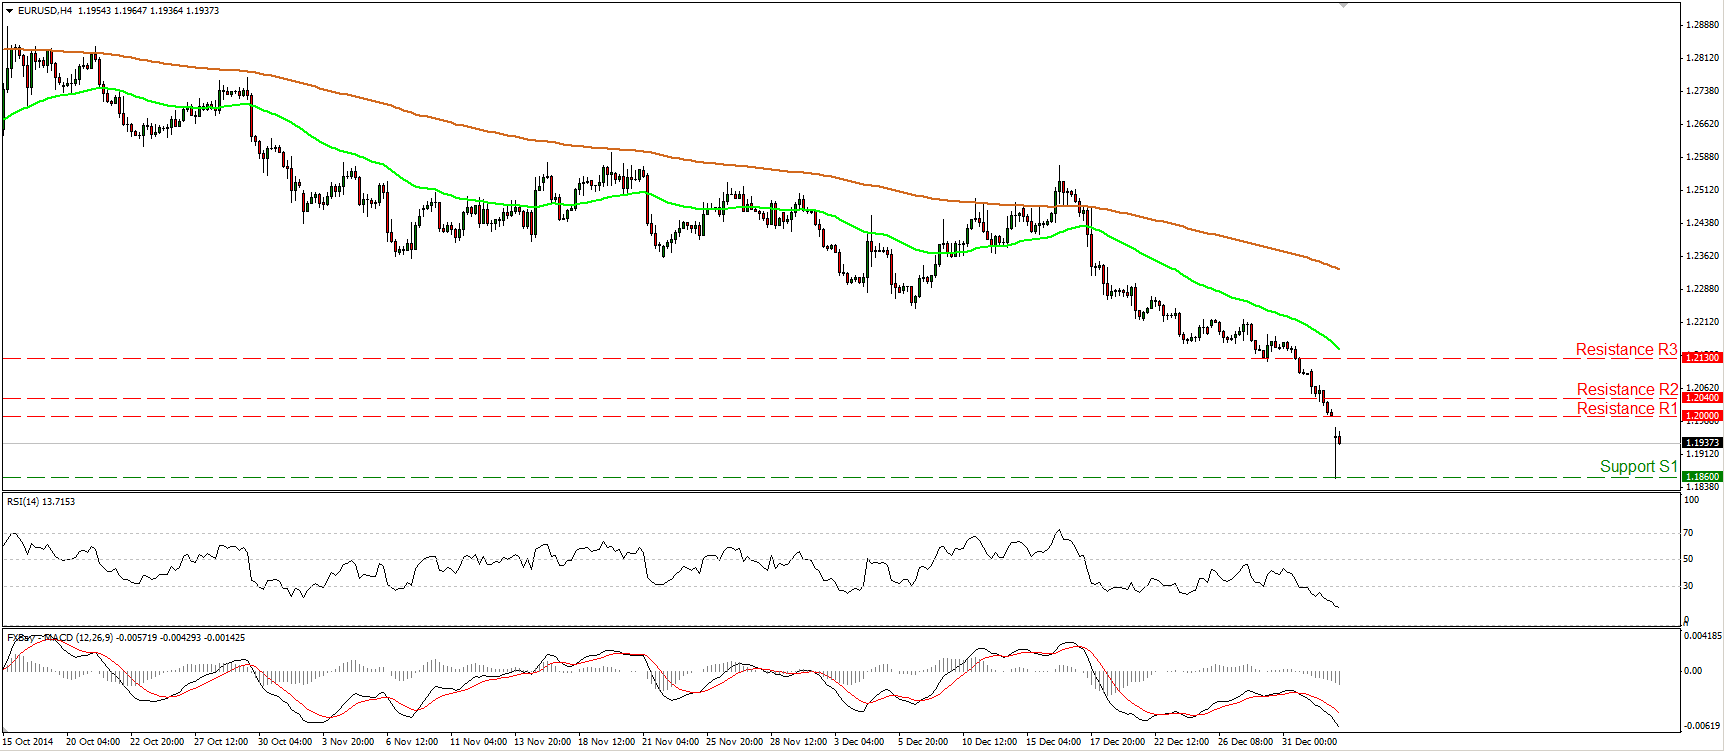
EUR/USD tumbled on Friday, breaking below the 1.2040 (R2) line and reaching the psychological zone of 1.2000 (R1). On Monday, the pair opened with a gap down and fell to hit support at 1.1860 (S1) before rebounding to trade near 1.1940. Given the dip below the 1.2000 (R1) area, the short-term picture remains to the downside and I would expect another test at the 1.1860 (S1) hurdle.
Today, the German inflation rate for December is expected to have slowed, which could pull the trigger for the aforementioned move. Our short-term oscillators corroborate the negative bias of EUR/USD. The RSI fell deeper into its oversold territory, while the MACD, already negative, moved further below its signal line. These signs designate accelerating bearish momentum and amplify the case for further declines. As far as the broader trend is concerned, I still see a longer-term downtrend. On the daily chart, we still have lower peaks and lower troughs below both the 50- and the 200-day moving averages.
• Support: 1.1860 (S1), 1.1775 (S2), 1.1700 (S3)
• Resistance: 1.2000 (R1), 1.2040 (R2), 1.2130 (R3)
GBP/USD plunged after the disappointing UK manufacturing PMI
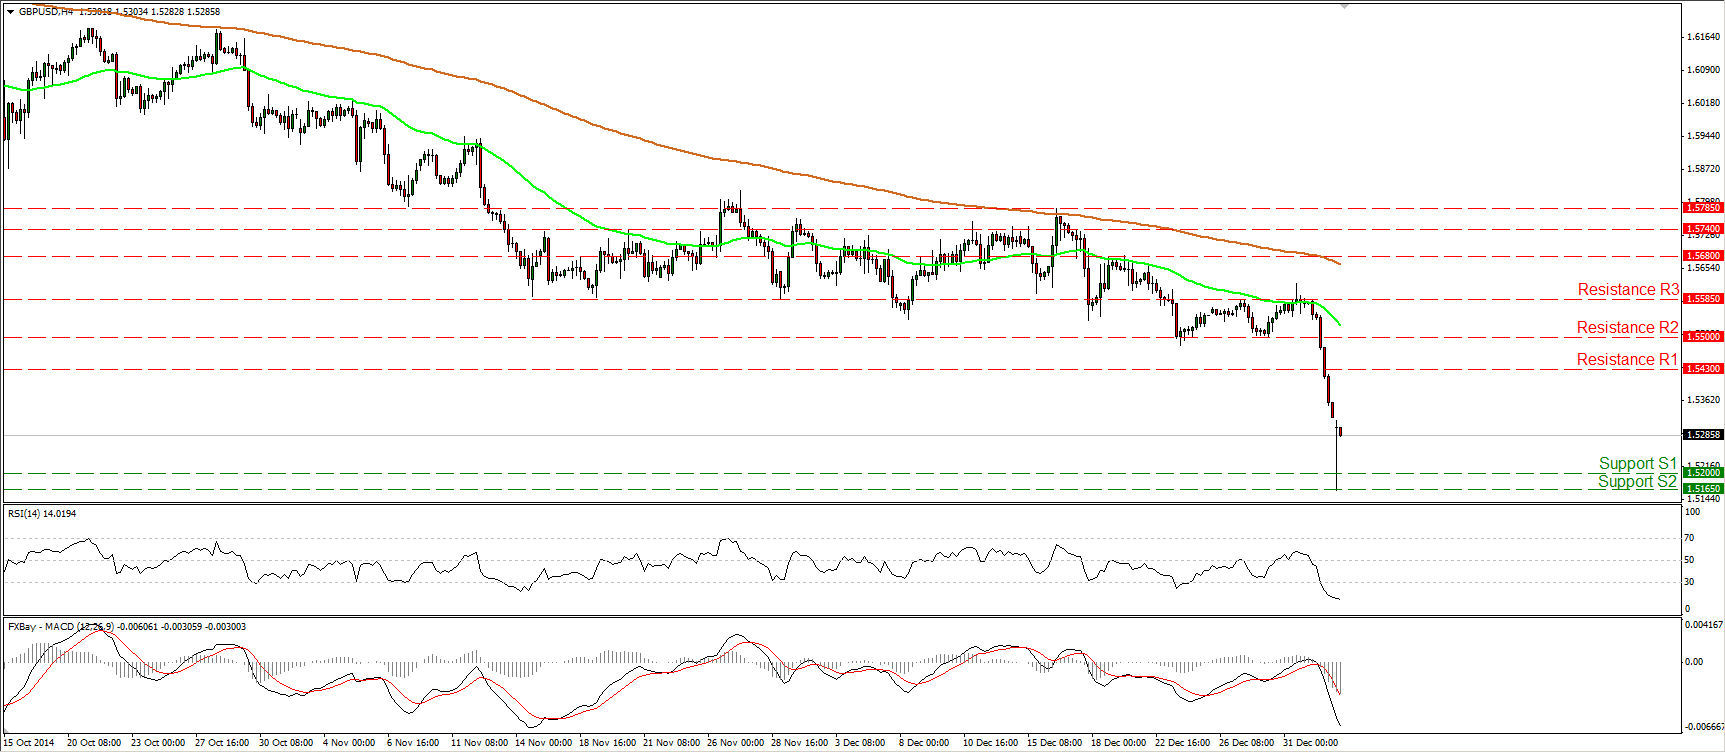
GBP/USD collapsed on Friday after the UK manufacturing PMI for December disappointed. The rate dipped below the psychological zone of 1.5500 (R2) and ignored our support (turned into resistance) obstacle of 1.5430 (R1), defined by the lows of the 14th and the 28th of August 2013.
On Monday the pair continued its plunge to hit support below the 1.5200 (S1) area (the low of the 7th of August 2013) before rebounding to trade near 1.5285. If today’s UK construction PMI for December is disappointing, it could set the stage for another move down towards the support obstacles of 1.5200 (S1) or 1.5165 (S2). As for the broader trend, I still say that as long as Cable is trading below the 80-day exponential moving average, the overall path remains to the downside.
• Support: 1.5200 (S1), 1.5165 (S2), 1.5100 (S3)
• Resistance: 1.5430 (R1), 1.5500 (R2), 1.5585 (R3)
EUR/JPY slides below 144.75
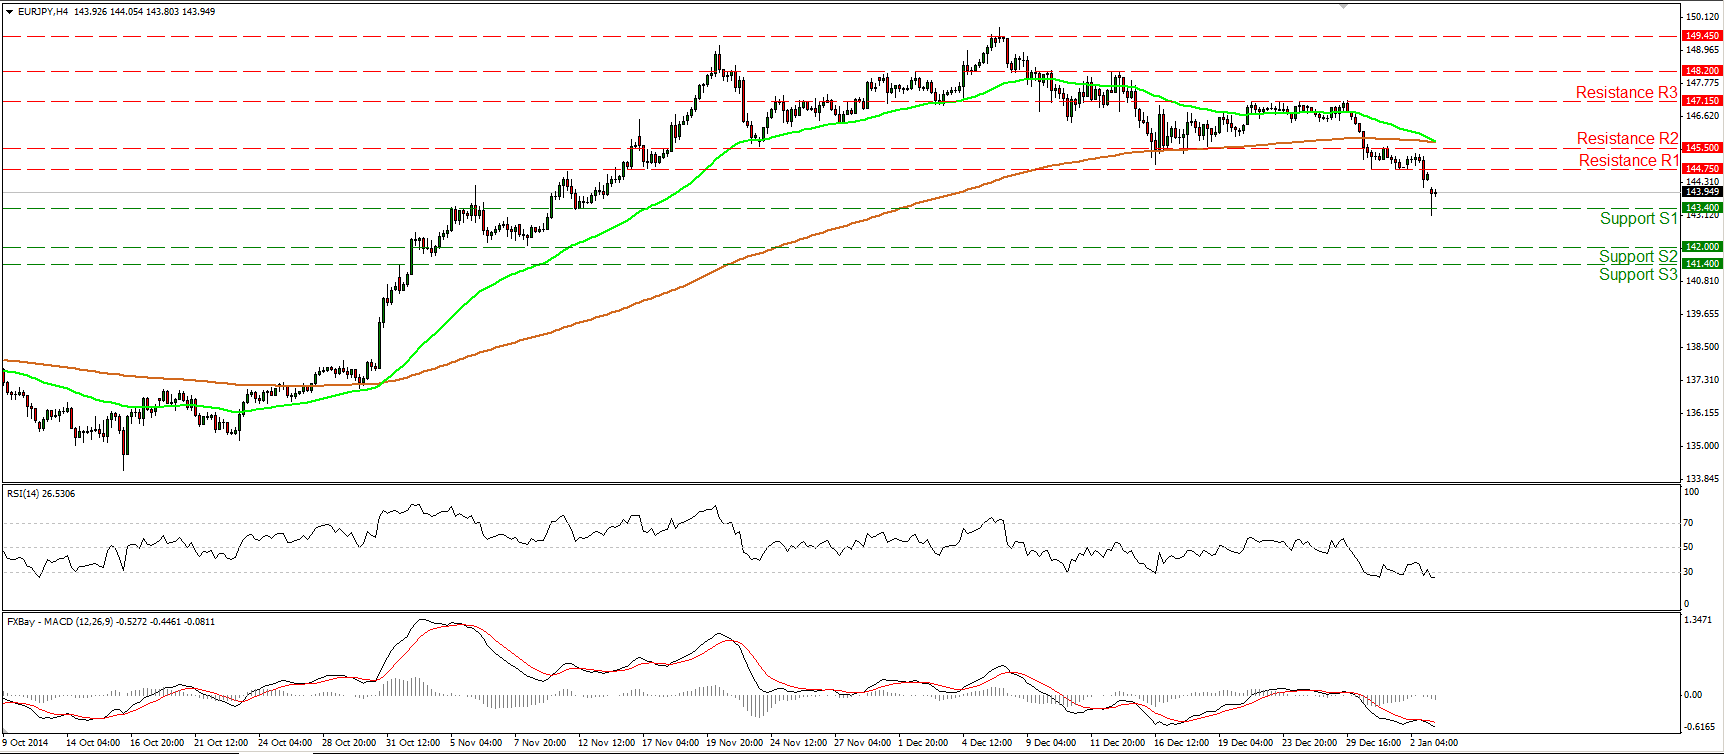
EUR/JPY declined and broke below the support (turned into resistance) barrier of 144.75 (R1). Today, this rate hit support slightly below the 143.40 line, where a clear violation could prompt extensions towards the 142.00 (S2) zone, defined by the low of the 10th of November. Taking a look at our near-term momentum studies, I see that the RSI is back within its oversold territory, while the MACD remains below both its zero and signal lines pointing south.
On the daily chart, I see a possible head and shoulders formation completed, something that increases the probabilities for further bearish extensions in the short term. Our daily momentum indicators support the notion. The 14-day RSI fell below its 50 line, while the MACD obtained a negative sign.
• Support: 143.40 (S1), 142.00 (S2), 141.40 (S3)
• Resistance: 144.75 (R1), 145.50 (R2), 147.15 (R3)
Gold rebounds from near 1173
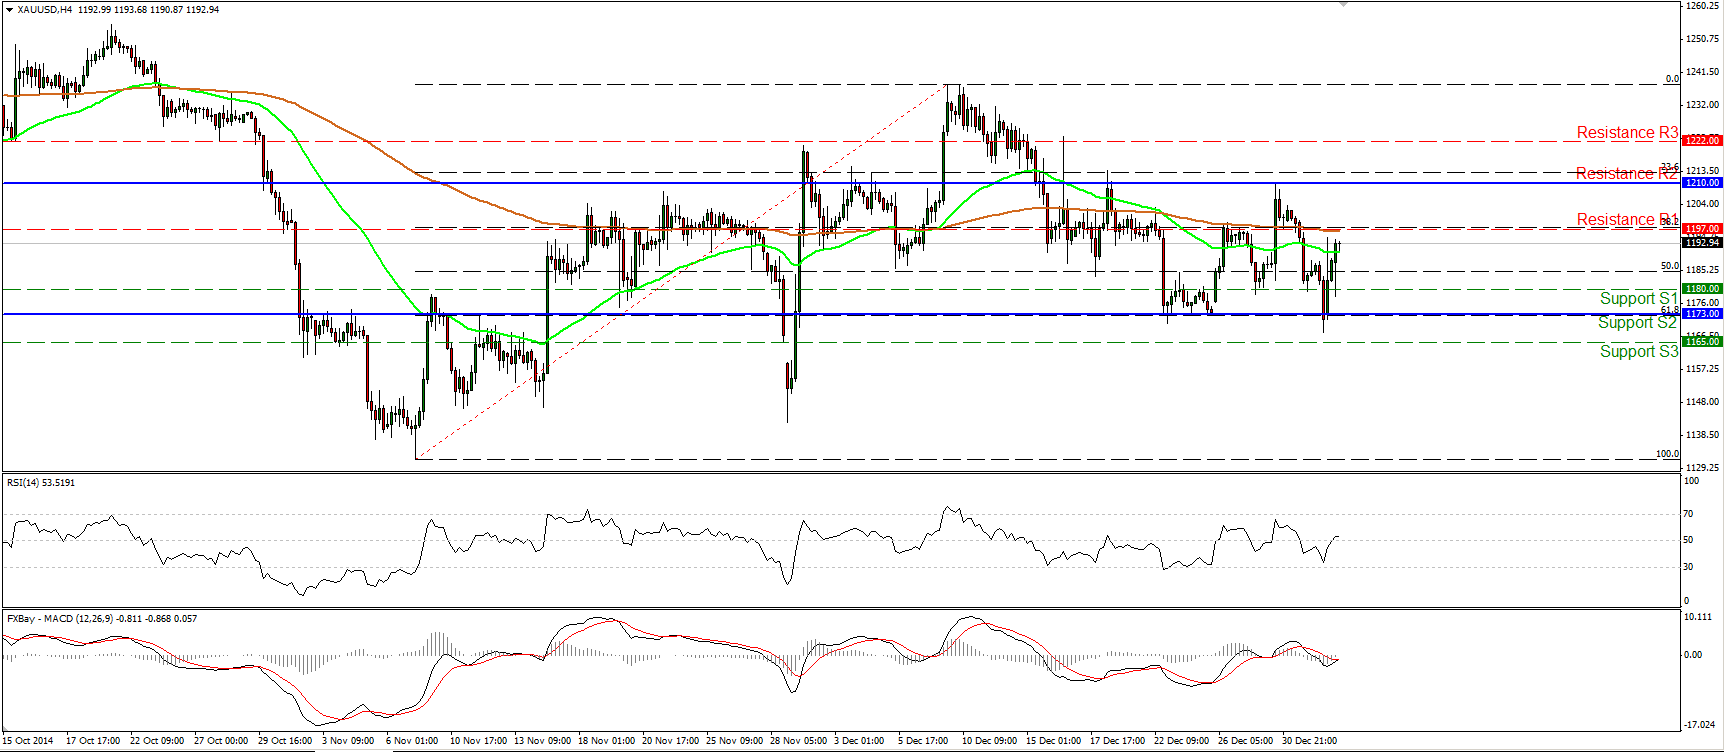
Gold declined but triggered buy orders slightly below the 1173 (S2) area which coincides with the 61.8% retracement level of the 7th of November – 9th of December advance. Given that the precious metal remains above that Fibonacci retracement level and below the resistance of 1210 (R2), and with no clear trending conditions in the near-term, I would prefer to maintain my “wait and see stance”, at least for now.
A dip below the 1173 (S2) barrier would probably shift the near term bias to the downside. On the other hand, only a move above 1210 (R2) could confirm a forthcoming higher high on the daily chart. Once again our oscillators do not confirm each other, adding to the mixed picture for the yellow metal. The RSI crossed above its 50 line, but looks able to dip back below it, while the MACD has crossed above its trigger, is pointing up, and could become positive soon.
• Support: 1180 (S1), 1173 (S2), 1165 (S3)
• Resistance: 1197 (R1), 1210 (R2), 1222 (R3)
WTI getting closer to the 50.00 zone
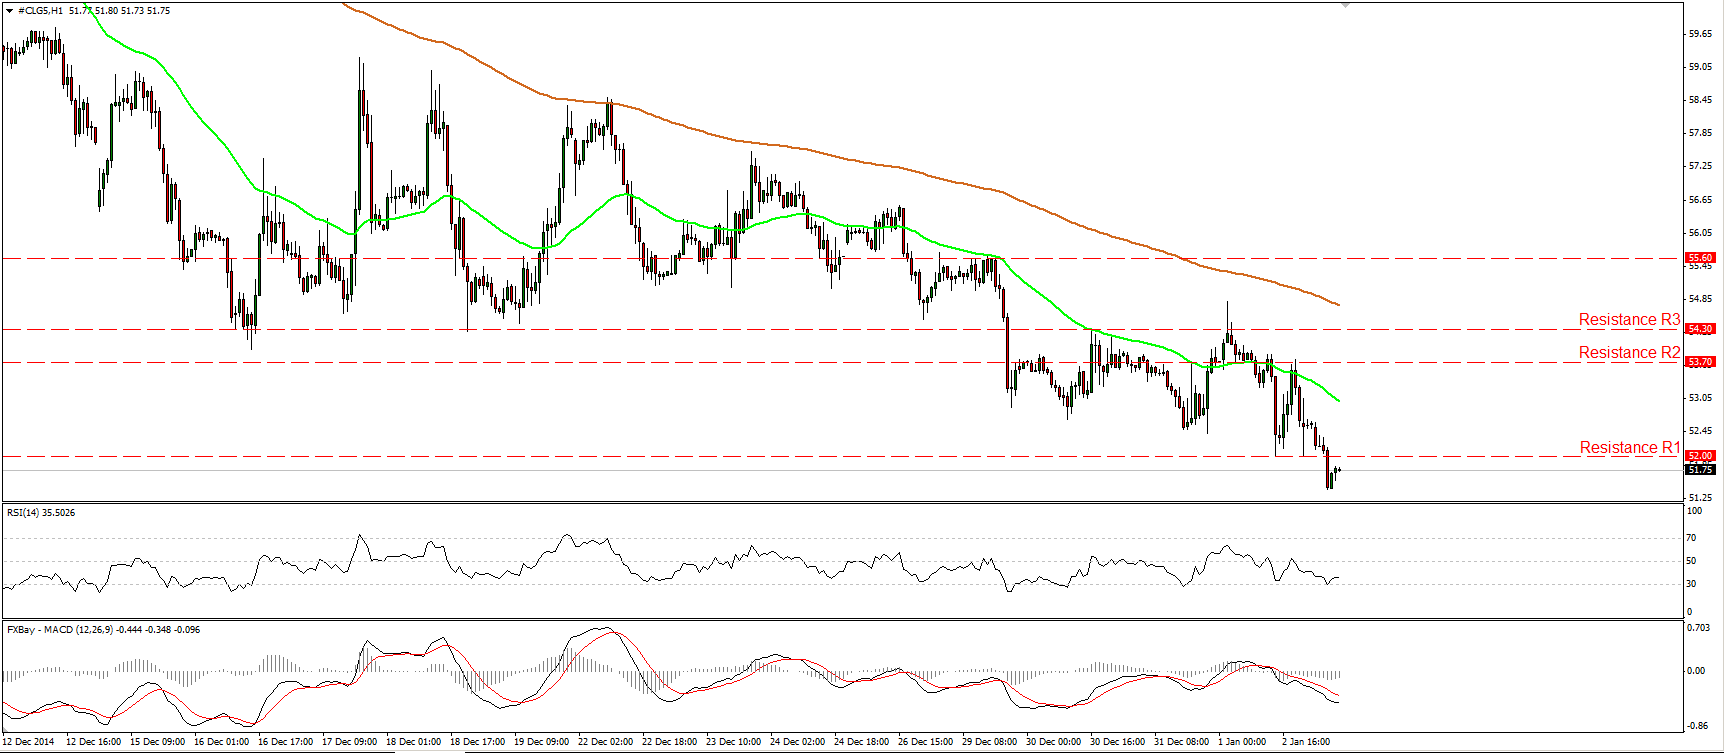
WTI moved lower on Friday, breaking below 52.00 (R1). This move confirmed a forthcoming lower low on the 1-hour chart and corroborates my view that the decline is likely to continue and challenge the psychological area of 50.00 (S1) in the not-too-distant future. As for our oscillators, the MACD remains below both its zero and signal lines, indicating strong bearish momentum, but the RSI rebounded somewhat after hitting its 30 line.
As I result, I would be careful of a minor bounce before sellers pull the trigger again. In the bigger picture, as long as WTI is printing lower peaks and lower troughs below both the 50- and the 200-day moving averages, the overall path stays to the downside.
• Support: 50.00 (S1), 48.00 (S2), 46.70 (S3)
• Resistance: 52.00 (R1), 53.70 (R2), 54.30 (R3)
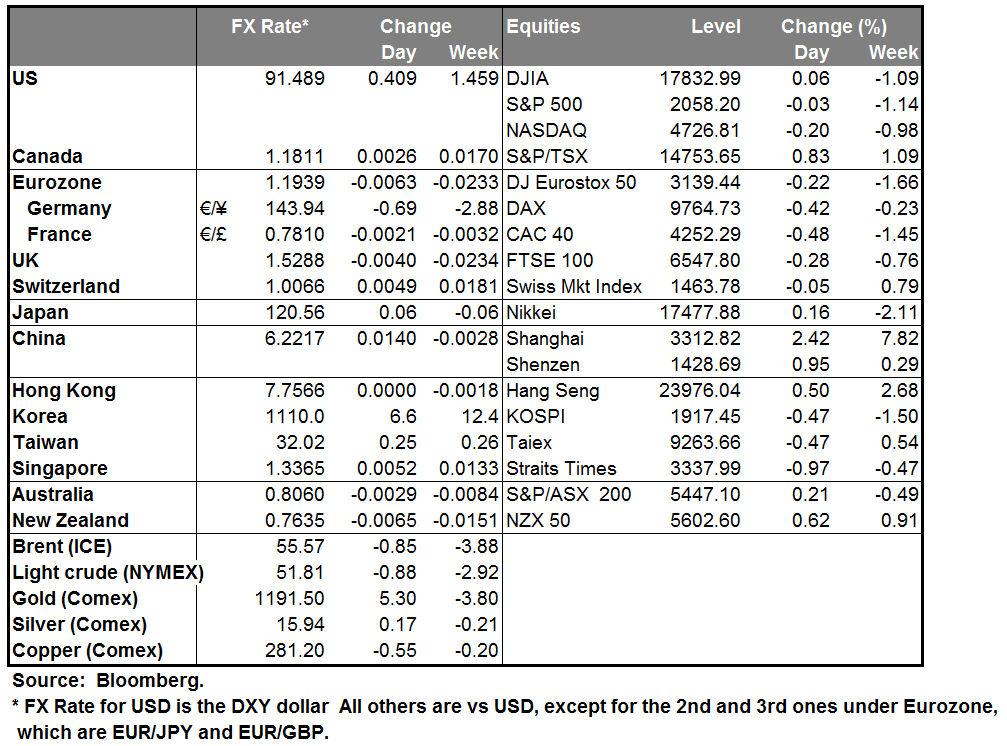
BENCHMARK CURRENCY RATES - DAILY GAINERS AND LOSERS

