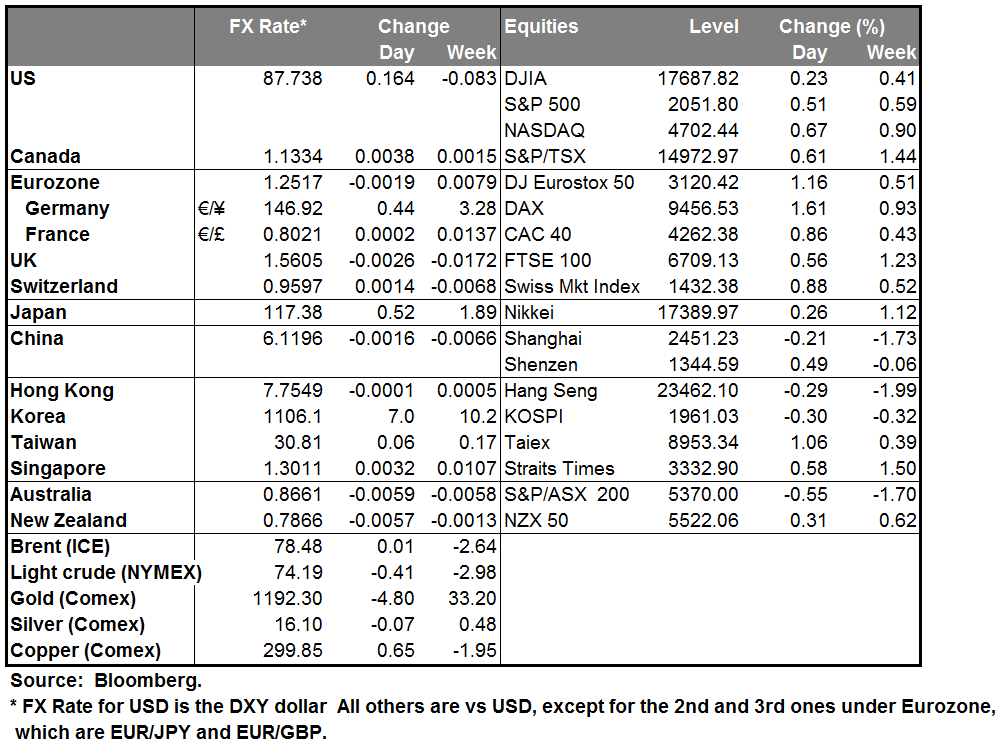
BoJ members show more agreement The Bank of Japan ended its two-day policy meeting and kept its massive stimulus program intact as was widely expected. Board member Takahide Kiuchi was the only dissenter of the current quantitative easing program in an 8-1 vote. This shows more agreement than on Oct. 31st, when the vote to increase the stimulus was divided into a 4-5 split. On Tuesday, Prime Minister Shinzo Abe announced that he was delaying the next hike in the consumption tax (initially scheduled for October 2015) and called a snap election as a referendum on the tax, likely in mid-December. Following the country’s GDP contraction on Monday, the various forthcoming data if weak, would likely keep the JPY under selling pressure.
The New Zealand dollar weakened the most against the dollar, after dairy product prices fell in the latest auction to the lowest level in more than five years. This pushed the NZD 1M volatility up approximately 4% to the levels seen in the beginning of 2014.
Today’s events: The focus will most likely be on the minutes from the latest Bank of England policy meeting. After the inflation report, where the Bank downgraded its growth and inflation forecasts and said that the inflation rate is likely to fall below 1% within 6 months, it will be interesting to see if Weale and McCafferty continued supporting a 25bps rate hike.
Besides the BoE meeting minutes, we get the minutes of the Oct.28-29 FOMC meeting. Here we will get more details on the decision to end the QE3 program and the view of the Fed members of an improving labor market. I believe that the market will also look for clues on when the Committee is considering to start raising rates. On the other hand, in their previous minutes, the Fed mentioned that a stronger dollar and a slower global growth are risks to the US economy. Since the release of September 16-17 FOMC meeting minutes, the DXY index has appreciated approximately 3% and the global growth showed signs of further weakness (Japan’s GDP: -0.4% qoq, Germany’s GDP: just 0.1% qoq and Eurozone’s 0.2% qoq, all for Q3). The risk that the Fed could reiterate its concern given these developments, could put a downward pressure on the USD.
As for the indicators, from Europe we get only Eurozone’s current account balance for September. In the US, both housing starts and building permits for October are expected to have increased indicating that the housing sector is growing again after a soft summer. The strong figures support the strength in the broader economy. Near the US closing, we have New Zealand’s PPI for Q3 coming out. However, no forecast is available.
We have four speakers scheduled during the day: ECB executive Board member Peter Praet, BoE MPC member Nemat Shafik, Norges Bank Governor Oeystein Olsen and Riksbank Deputy Governor Martin Floden.
The Market
EUR/USD gains after the German ZEW survey
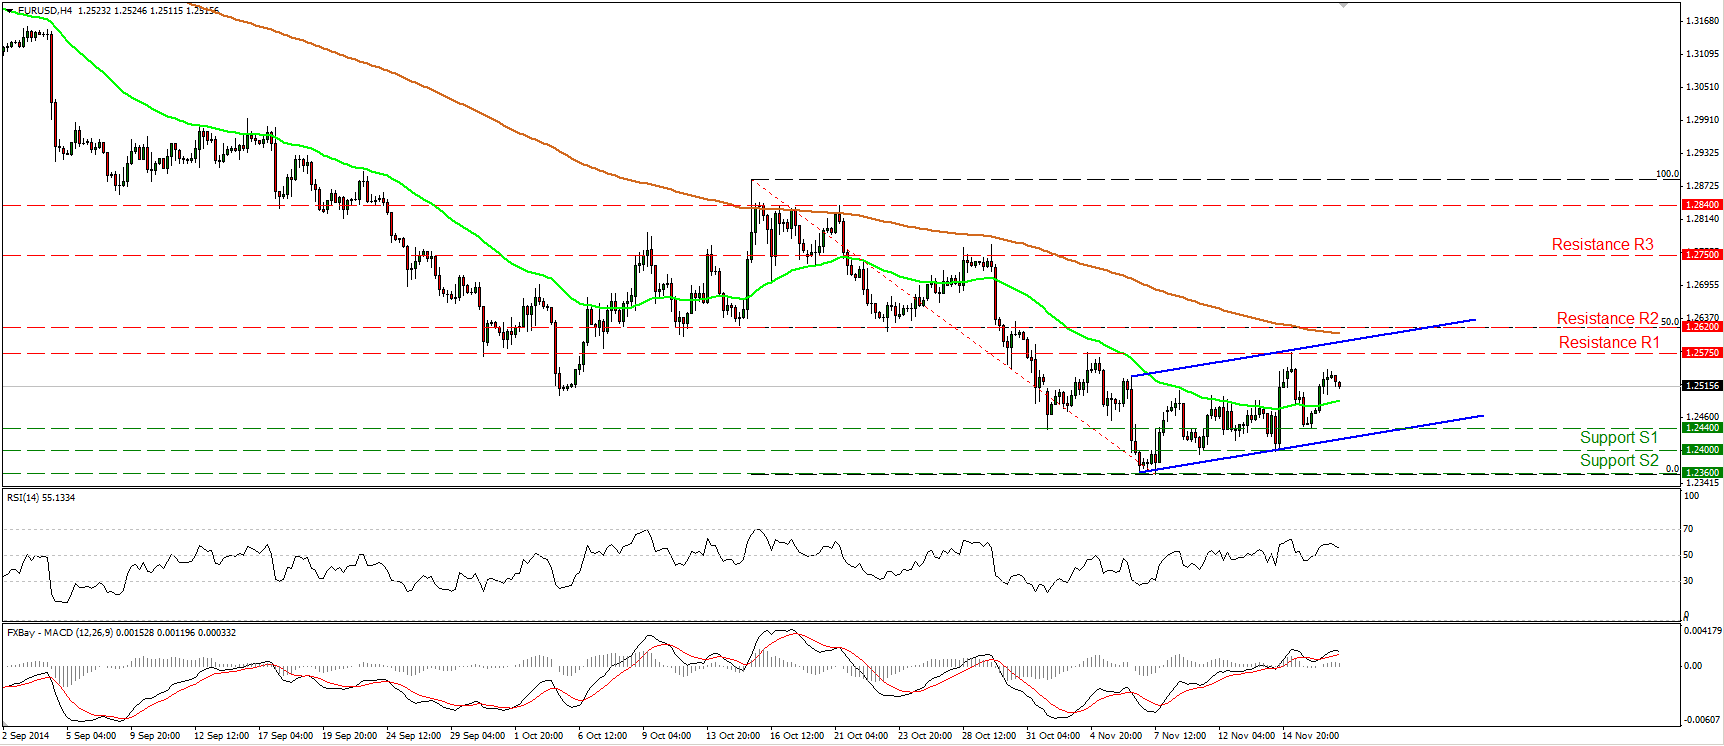
EUR/USD started rising well before the German ZEW survey for November was out and got another boost after the release. However, the advance was stopped 30 pips below our resistance of 1.2575 (R1). As long as the rate remains within the blue upside channel, I would maintain my flat stance and treat the recovery from 1.2360 (S3) as a corrective move. In the bigger picture, the price structure on the daily chart still suggests a downtrend, but there is still positive divergence between both of our daily momentum studies and the price action, which indicates decelerating negative momentum. The positive divergence give me extra reasons to sit on the sidelines and wait for more actionable signs to convince me that the downtrend is back in force and likely to continue.
• Support: 1.2440 (S1), 1.2400 (S2), 1.2360 (S3)
• Resistance: 1.2575 (R1), 1.2620 (R2), 1.2750 (R3)
USD/JPY breaks above 117.00
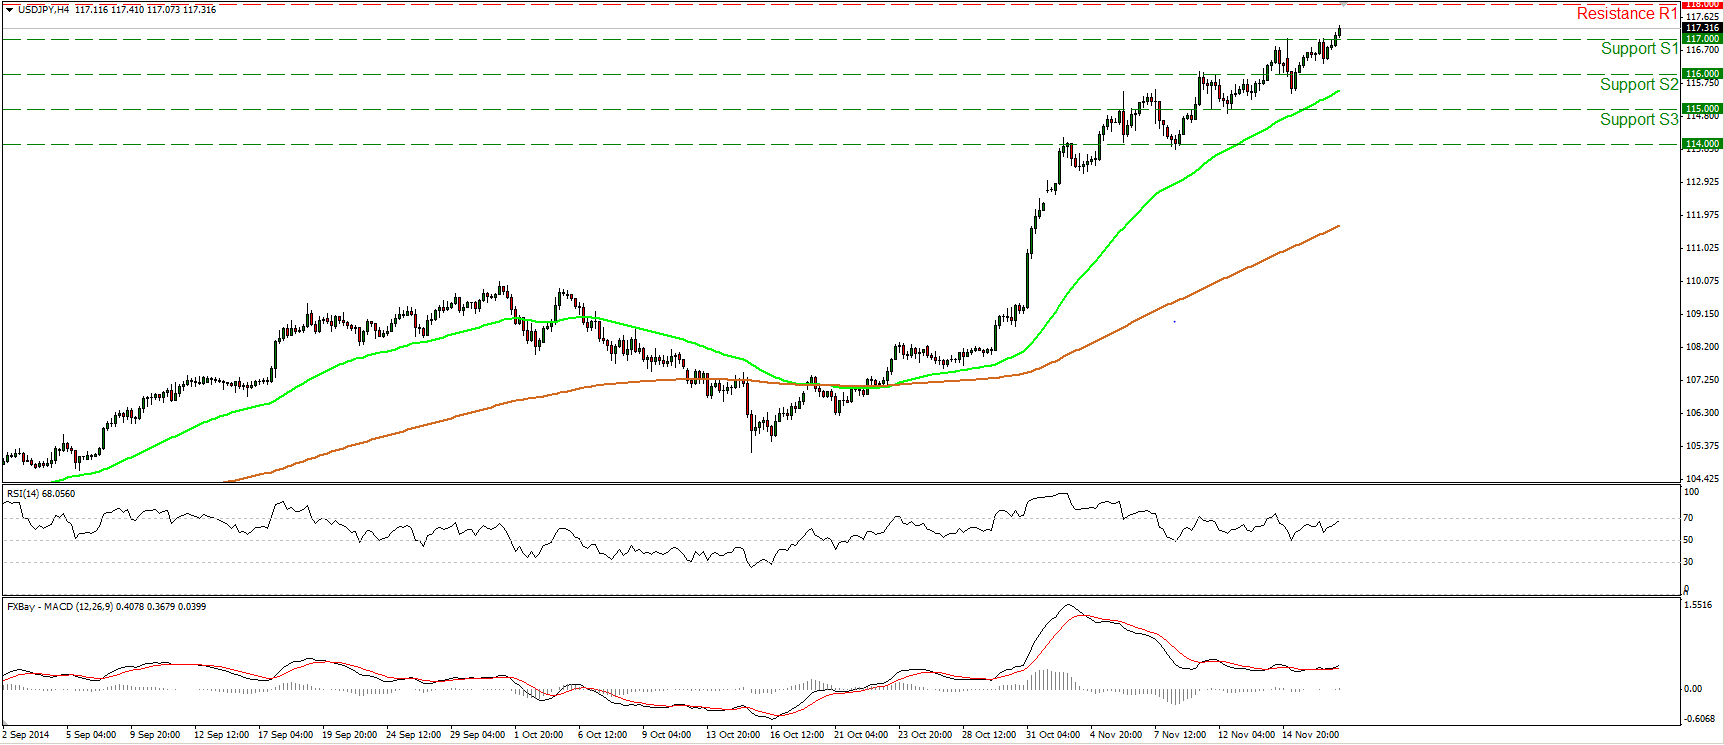
USD/JPY firmed up on Tuesday, breaking above the resistance (turned into support) barrier of 117.00 (S1). I would now expect the rate to challenge the 118.00 (R1) hurdle, defined by the high of the 15th of October 2007. A break above that barrier could see scope for extensions towards the highs of August 2007, near the psychological zone of 120.00 (R2). Shifting our attention to our near-term oscillators, I see that the RSI is pointing up and could challenge its 70 line in the very close future, while the MACD, already positive, stands above its trigger line. This designates bullish momentum and support further advances. As for the broader trend, after the upside exit of a triangle formation on the 29th of July, the price structure has been higher peaks and higher troughs above both the 50- and the 200-day moving averages, keeping the overall path of this pair to the upside.
• Support: 117.00 (S1), 116.00 (S2), 115.00 (S3)
• Resistance: 118.00 (R1), 120.00 (R2), 122.50 (R3)
GBP/USD testing the 1.5600 line
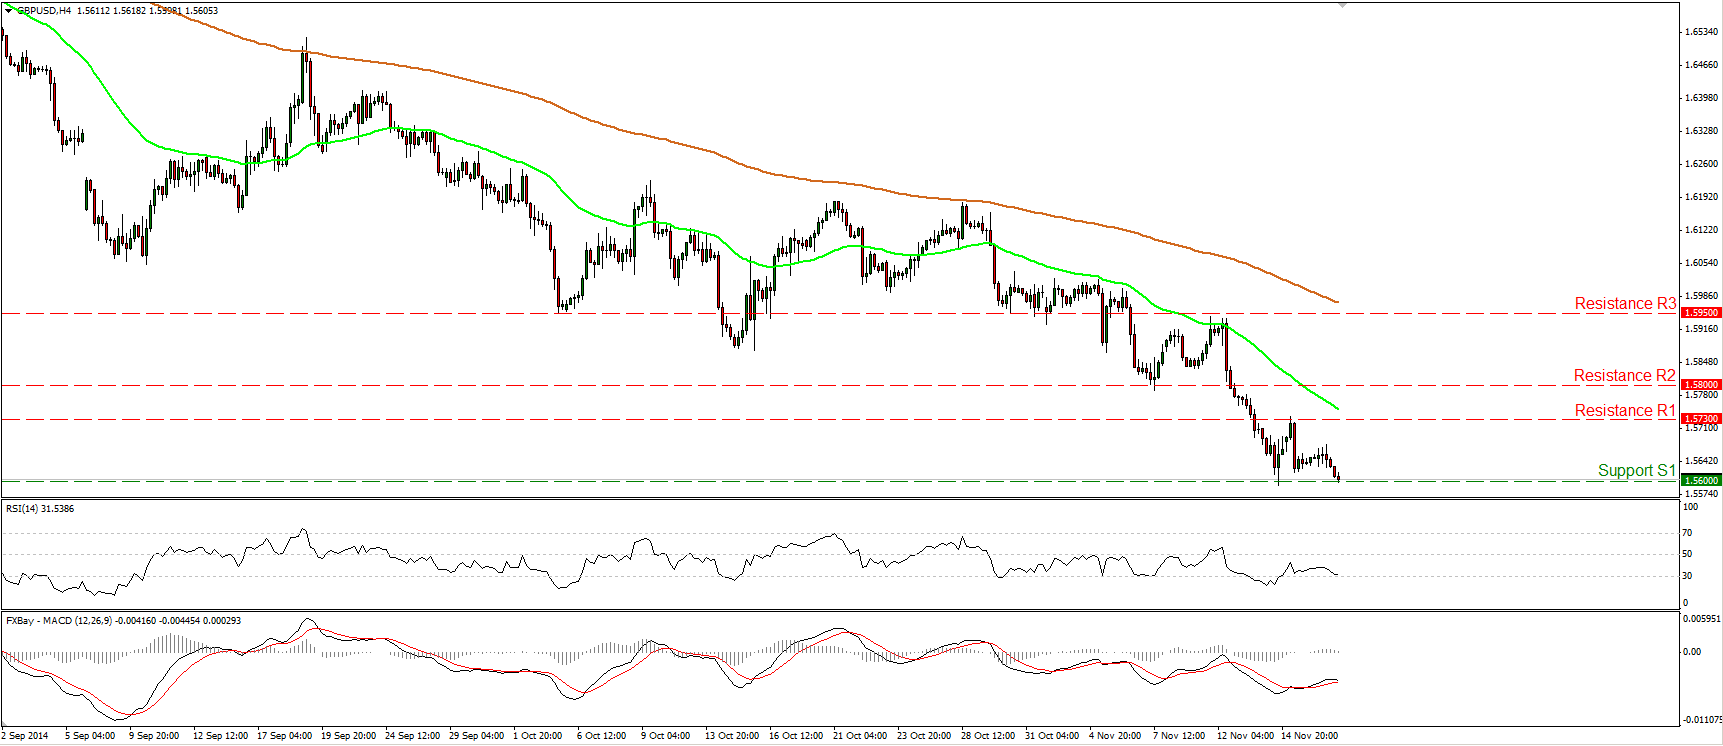
GBP/USD slid on Tuesday and during the European morning Wednesday, it is testing the 1.5600 (S1) support line. A dip below that line is likely to open the way for the psychological barrier of 1.5500 (S2). The RSI moved lower and looks ready to enter its oversold field, while the MACD, already negative, could cross below its trigger any time soon. These momentum signs designate bearish momentum and support the case for further declines in the near future. As for the broader trend, I will repeat for an umpteenth time that as long as Cable is trading below the 80-day exponential moving average, the overall path remains to the downside in my view.
• Support: 1.5600 (S1), 1.5500 (S2), 1.5430 (S3)
• Resistance: 1.5730 (R1), 1.5800 (R2), 1.5950 (R3)
Gold finds resistance near 1205
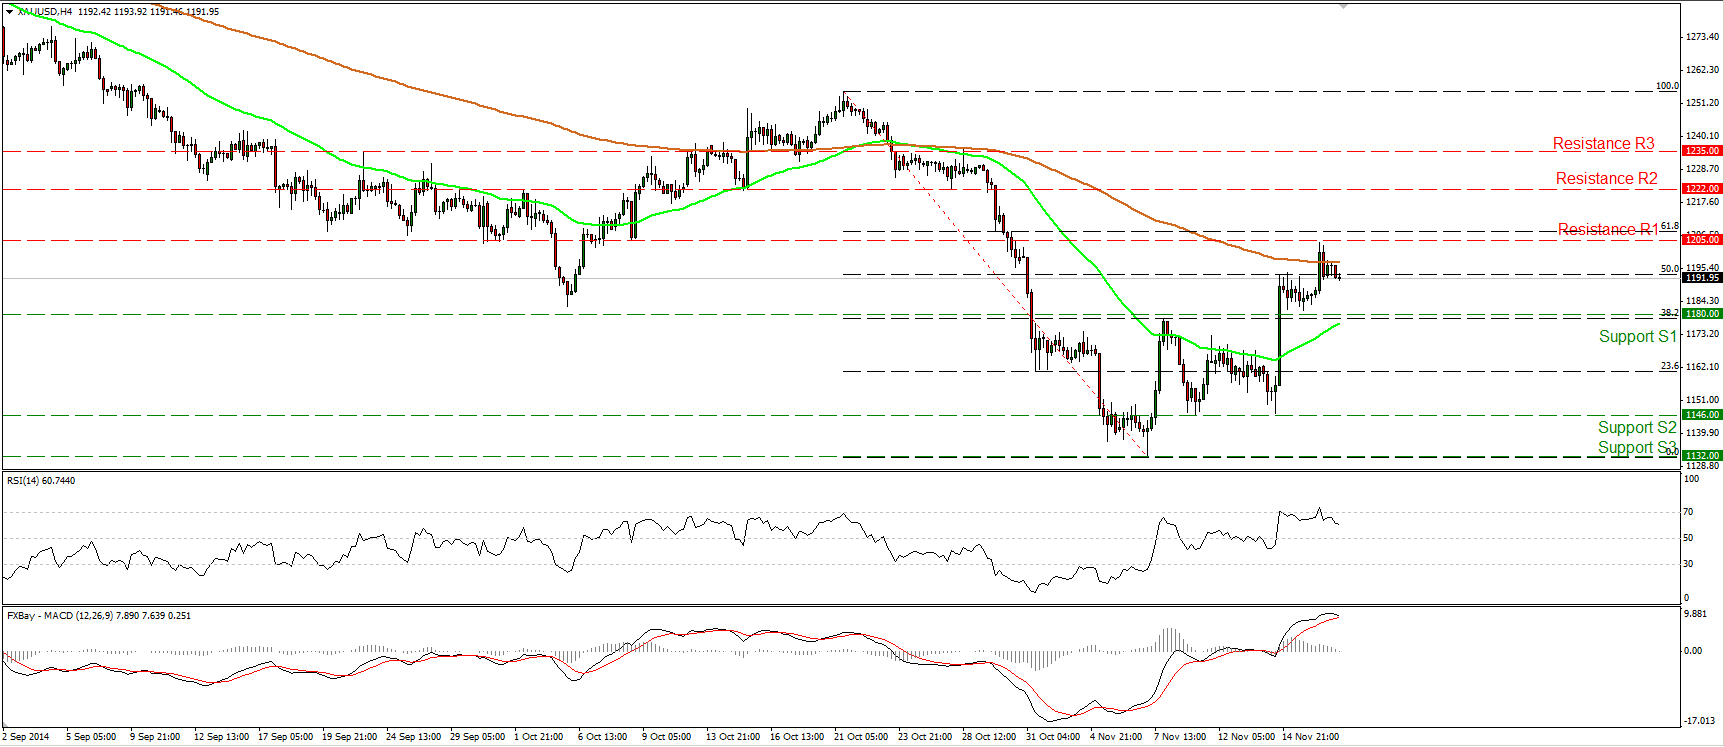
Gold emerged above 1195 and the 50% retracement level of the 21st October – 7th of November down wave. Subsequently, the yellow metal found resistance a few cents below our 1205 hurdle and pulled back. Taking a look at our short-term momentum studies, I see that the RSI moved lower after exiting its overbought territory, while the MACD has topped and appears willing to cross below its trigger line. These signals amplify the case that the pullback may continue, perhaps for a test near the 1180 (S1) zone. Although the minor pullback may provide more buying opportunities and trigger another short-term leg up, regarding the broader trend, I still see a longer-term downtrend. Hence, on the absence of any major bullish trend reversal signal, I would prefer to adopt a “wait and see” stance as far as the overall outlook of the precious metal is concerned.
• Support: 1180 (S1), 1146 (S2), 1132 (S3)
• Resistance: 1205 (R1), 1222 (R2), 1235 (R3)
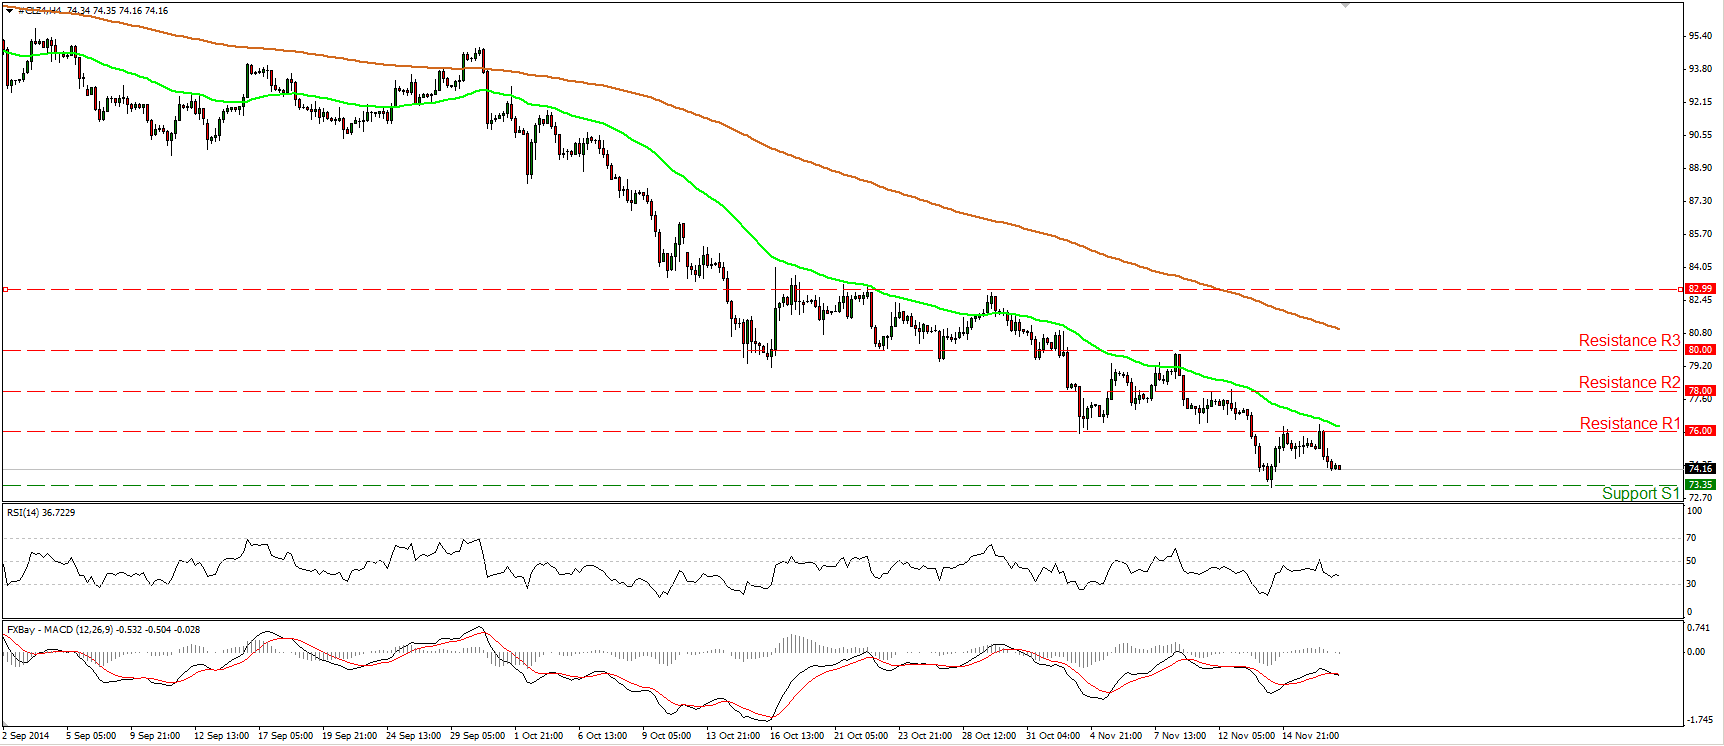
WTI lower after testing again the 76.00 zone
WTI tumbled yesterday after finding resistance once again near the 76.00 (R1) line. This confirms a lower high and keeps the near-term bias of WTI to the downside. A clear move below the support obstacle of 73.35 (S1) would confirm a forthcoming lower low and perhaps set the stage for extensions towards our next support at 71.00 (S2), defined by the lows of July and August 2010. Our near-term oscillators maintain a negative tone as well. The RSI moved lower after finding resistance marginally above its 50 line, while the MACD, already negative, dipped below its trigger line. In the bigger picture, the price structure on the daily chart remains lower peaks and lower troughs below both the 50- and the 200-day moving averages, keeping the overall picture negative.
• Support: 73.35 (S1), 71.00 (S2), 70.00 (S3)
• Resistance: 76.00 (R1), 78.00 (R2), 80.00 (R3)

