Bond Markets Take Center Stage
The action yesterday was in global bond markets as yields in the UK, Germany and the US slid to 2014 lows. The Bank of England’s inflation report was less hawkish than many had expected. The inflation forecasts made on the basis of market interest rates showed inflation slightly below target in two to three years’ time, which suggests that the Bank has room to raise rates at a slower pace than the market expects. UK bond yields fell across the curve as a result (10-year yields down a sharp 10 bps), and as for GBP/USD, the assault on 1.70 is on hold for now, although the technical picture still looks bullish; see below for EUR/GBP.
On the continent, both core and peripheral bond yields fell as the market continued to price in an easing of monetary policy at next month’s ECB meeting. ECB Executive Board member, Yves Mersch, yesterday confirmed that ECB President Draghi’s comment about the ECB being “comfortable” moving in June was a coded statement meant to convey to the market that a change in policy was imminent, while Executive Board member Praet told Die Zeit that the ECB is considering a range of policy measures including new long-term refinancing operations (LTROs) and cutting rates into negative territory. Ten-year Bund yields declined by 5 bps to the lowest level since the talk of the Fed “tapering” began last year.
Even US bond yields joined in the global rally despite US producer price inflation hitting a two-year high in April. The 10-year note was down 7 bps while Fed Funds expectations collapsed 7.5 bps in the long end.
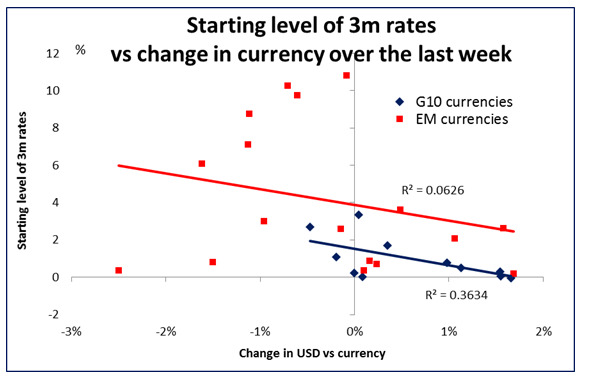
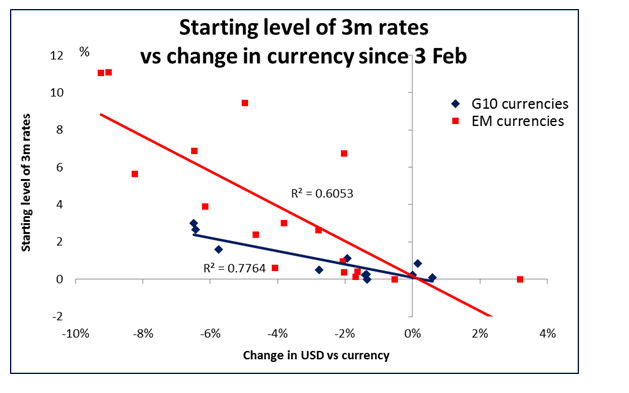
The FX implications of this global bond market rally are clear: carry is king and EM currencies should be doing better as the rally take the pressure off these countries to raise rates. For example, RUB was the biggest gainer over the last 24 hours despite the worsening situation in the Ukraine, which the Russian Foreign Minister has characterized as “as close to civil war as you can get,” which doesn’t seem like an exaggeration. In the emerging market space, this would tend to favour TRY, RUB, INR, IDR, ZAR, BRL, although clearly there is more than just interest rates to worry about here; TRY was the weakest of the EM currencies we track over the last 24 hours, while I would not recommend RUB at this time for obvious reasons. In developed markets, NZD, AUDand NOKwould tend to be the beneficiaries of increased emphasis on carry, although personally I question the sustainability of any AUD rally.
On Thursday, during the Asian morning, Japan started off a round of GDP announcements. Its preliminary GDP for Q1 accelerated to +1.5% quarter-on-quarter (qoq) from +0.2% qoq, exceeding even the optimistic consensus forecast of +1.0%, but this was no doubt distorted by the impact of the hike in the consumption tax, which caused an increase in retail sales and a drop in exports. The run-up in consumer spending and capital investment ahead of the tax hike were more than expected; we now have to see whether those jumps simply brought forward spending ahead of the tax hike or represent a sustainable increase in demand. The market is predicting the former, as forecasts for Q2 GDP are for a 3.3% contraction.
During the European day, more GDP data are coming out from France, Italy, Germany and the eurozone as a whole. Eurozone’s preliminary GDP is expected to have accelerated to +0.4% qoq in Q1 from +0.2% qoq in Q4, driving the yoy rate up to +1.1% from +0.5%. Eurozone’s final CPI for April is also coming out, to confirm the initial estimate of +0.7% year-on-year (yoy). Moreover, the ECB publishes its monthly report, together with its survey of professional forecasters on inflation. Much of the data, particularly commodity prices, suggests inflation forecasts should be unchanged to higher, so if forecasts are instead lowered, it would tell the ECB that inflation expectations have declined. That would be a strong signal to the council that they need to take some action.
There is a lot of data coming out from the US. The headline CPI is forecast to have accelerated to +2.0% yoy in April from +1.5% yoy, which should be bullish USD as it makes it more likely that the hawks at the Fed will argue for early tightening (although remember that this is not the measure of inflation that the Fed targets – the Fed targets the personal consumption expenditure deflator, which is running around 1.1% yoy). The Empire State manufacturing survey for May is forecast to have risen, while the Philadelphia Fed business activity index is forecast to have declined, so the impact of these two may offset each other. Initial jobless claims for the week ended on May 10 are expected to be more or less the same as the previous week. Industrial production is forecast to have remained unchanged mom in April after rising +0.7% month-on-month (mom) in March.
We have three speakers on Thursday. During the Asian morning, Bank of Japan Governor Haruhiko Kuroda gives a speech at an event in Tokyo. As for the European day, ECB Vice President, Vitor Constancio, and ECB Executive Board member, Yves Mersch will also speak.
The Market
EUR/USD Consolidates Above 1.3695
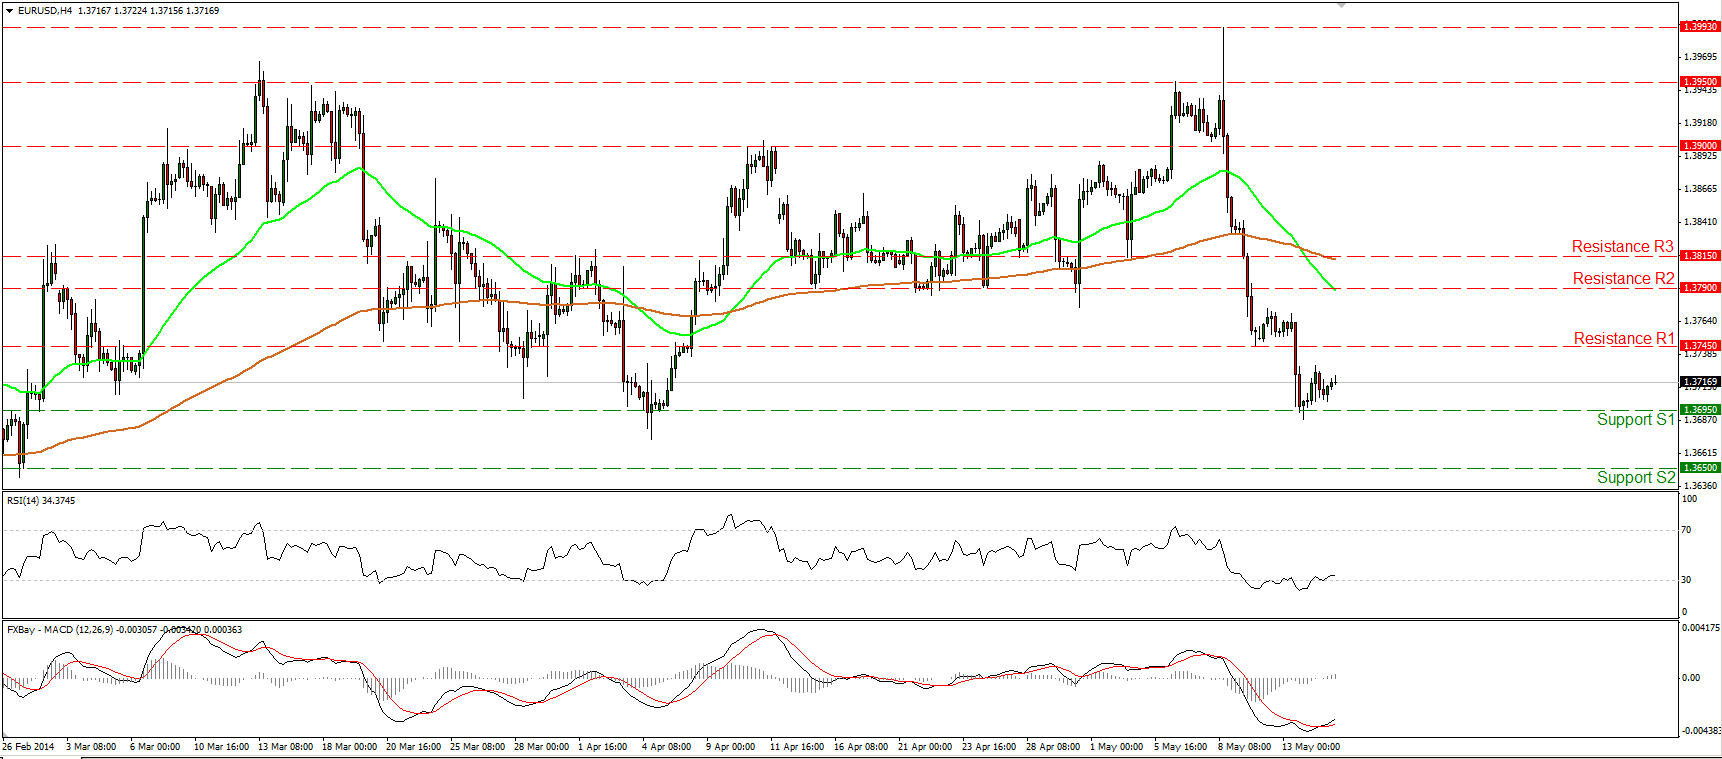
EUR/USD moved in a consolidative mode, remaining supported by the 1.3695 (S1) barrier. A clear dip below that support may see the next hurdle at 1.3650 (S2). Nonetheless, considering that the RSI exited its oversold territory and the MACD crossed above its trigger line, I would expect the forthcoming wave to be an upside retracement, maybe to test the 1.3745 (R1) resistance before the bears take control again. The 50-period moving average remains below the 200-period moving average, confirming the negative picture of the pair. On the daily chart, the negative divergence between the MACD and the price action is still in effect, while on the weekly chart, we see a bearish engulfing candle formation, increasing the possibilities for further declines.
• Support: 1.3695 (S1), 1.3650 (S2), 1.3600 (S3).
• Resistance: 1.3745 (R1), 1.3790 (R2), 1.3815 (R3).
USD/JPY Remains Trendless
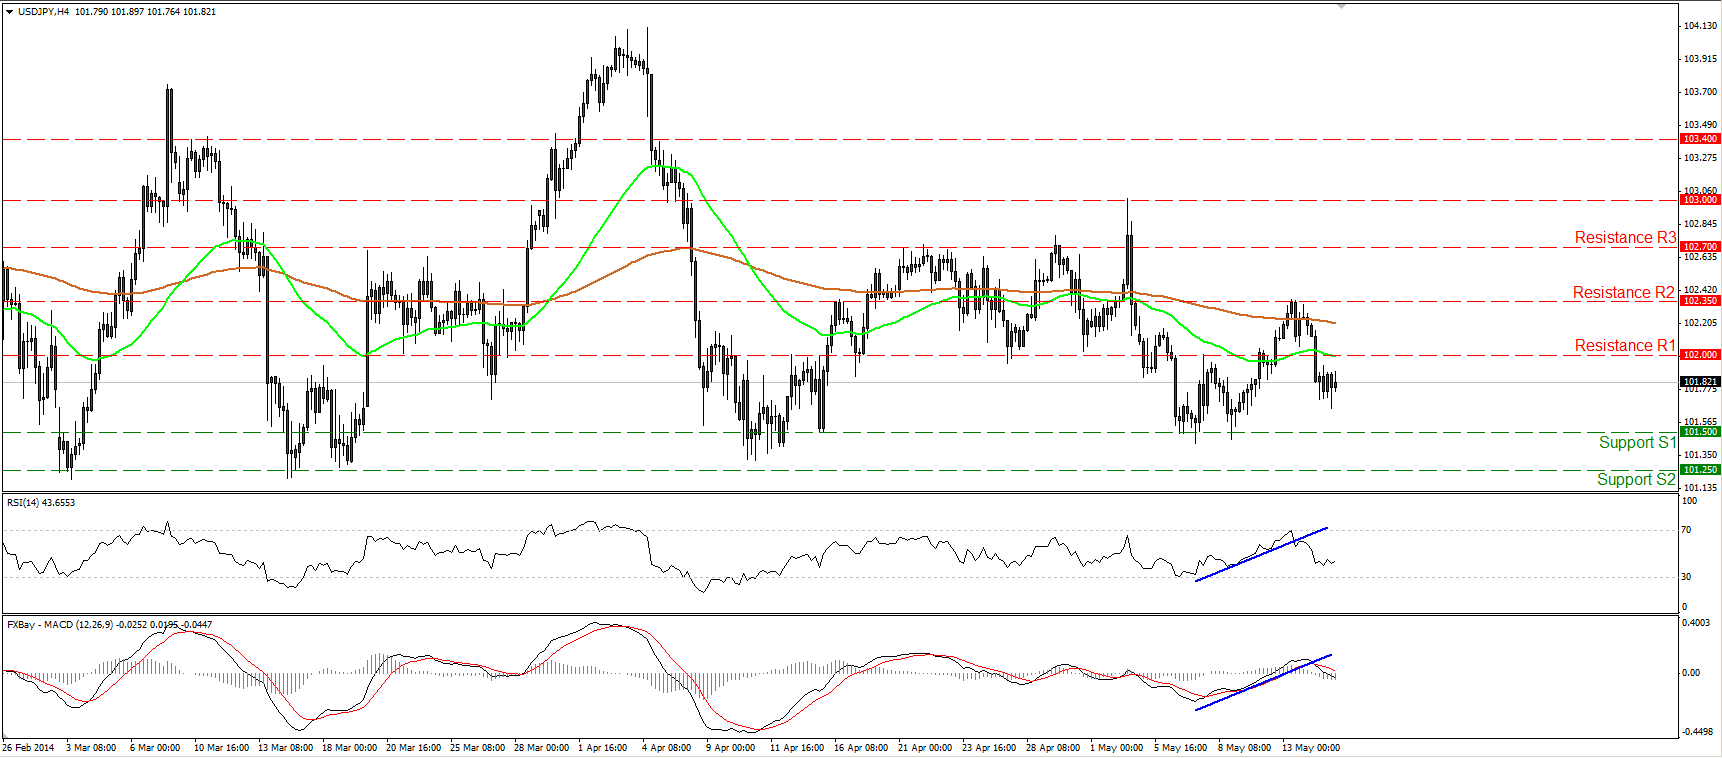
USD/JPY met resistance at 102.35 (R2) and moved lower to trade below the 102.00 bar. The rate is back below both the moving averages, while both our momentum studies fell below their support lines. If the bears continue their momentum, they may challenge again the support of 101.50 (S1), where a dip could target the next support at 101.25 (S2). However, I would prefer to remain neutral on this currency pair since we do not have a clear trending structure. On the daily chart, both the daily RSI and the daily MACD remain near their neutral levels, confirming the trendless mode of the price action.
• Support: 101.50 (S1), 101.25 (S2), 100.75 (S3).
• Resistance: 102.00 (R1), 102.35 (R2), 102.70 (R3).
EUR/GBP Higher After the BoE Inflation Report.
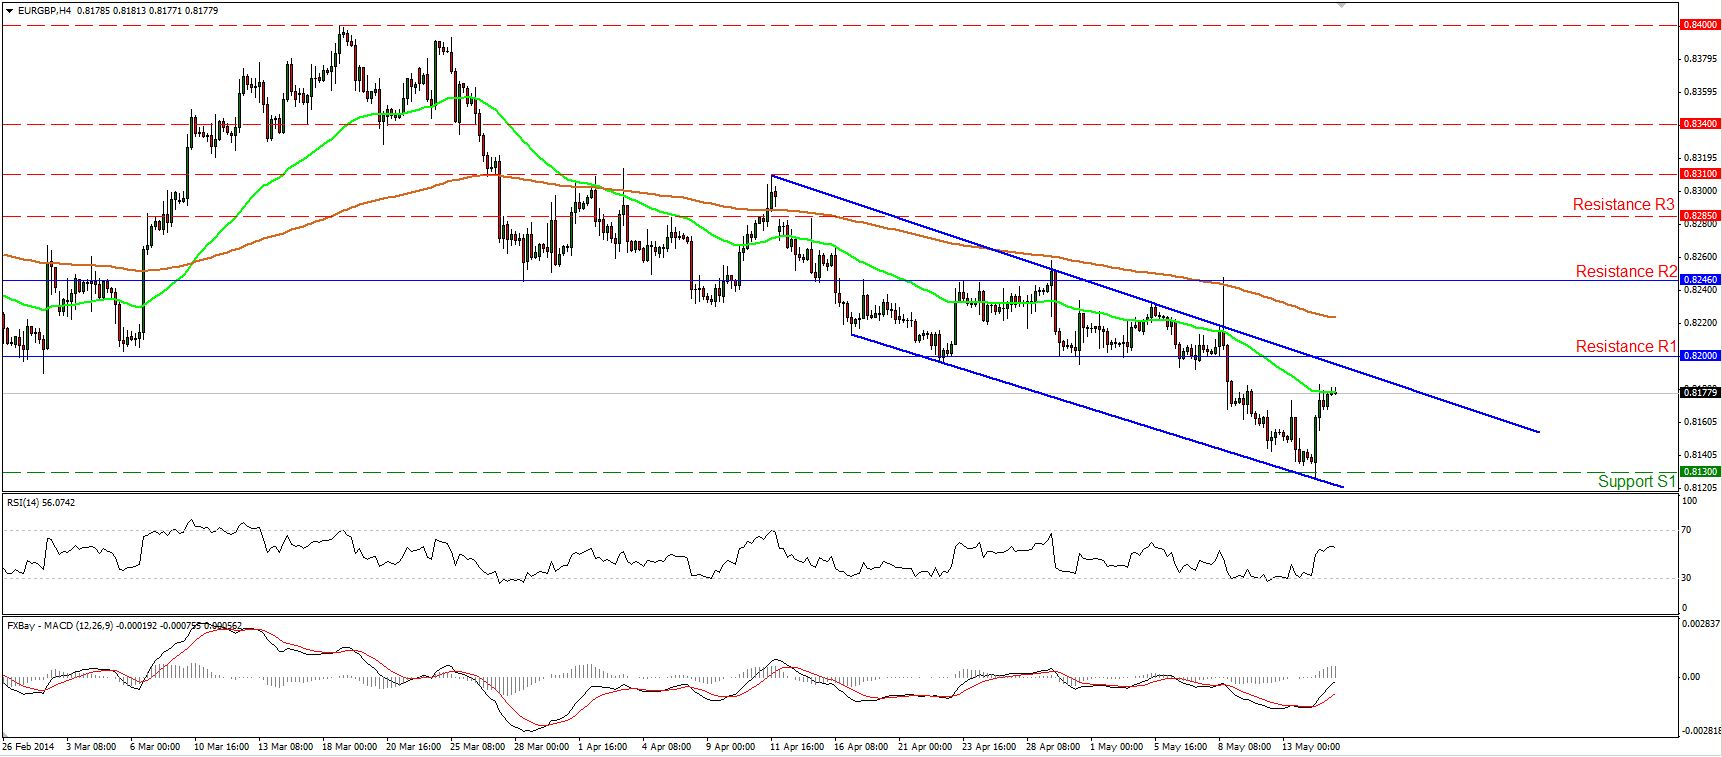
EUR/GBP rallied after the UK employment data for March and the BoE’s quarterly inflation report, where Governor Carney said slack remains in the economy. Nonetheless, since the rate remains below the blue downtrend line and the resistance of 0.8200 (R1), I still consider the downside path to remain intact. Considering that the MACD lies above its trigger line, although in bearish territory, I would expect the rate to meet resistance near the downtrend line below the 0.8200 (R1) bar. If the bears take control near that zone, I would expect them to challenge the 0.8130 (S1) support again.
• Support: 0.8130 (S1), 0.8080 (S2), 0.8035 (S3).
• Resistance: 0.8200 (R1), 0.8246 (R2), 0.8285 (R3).
Gold Above 1300 Again
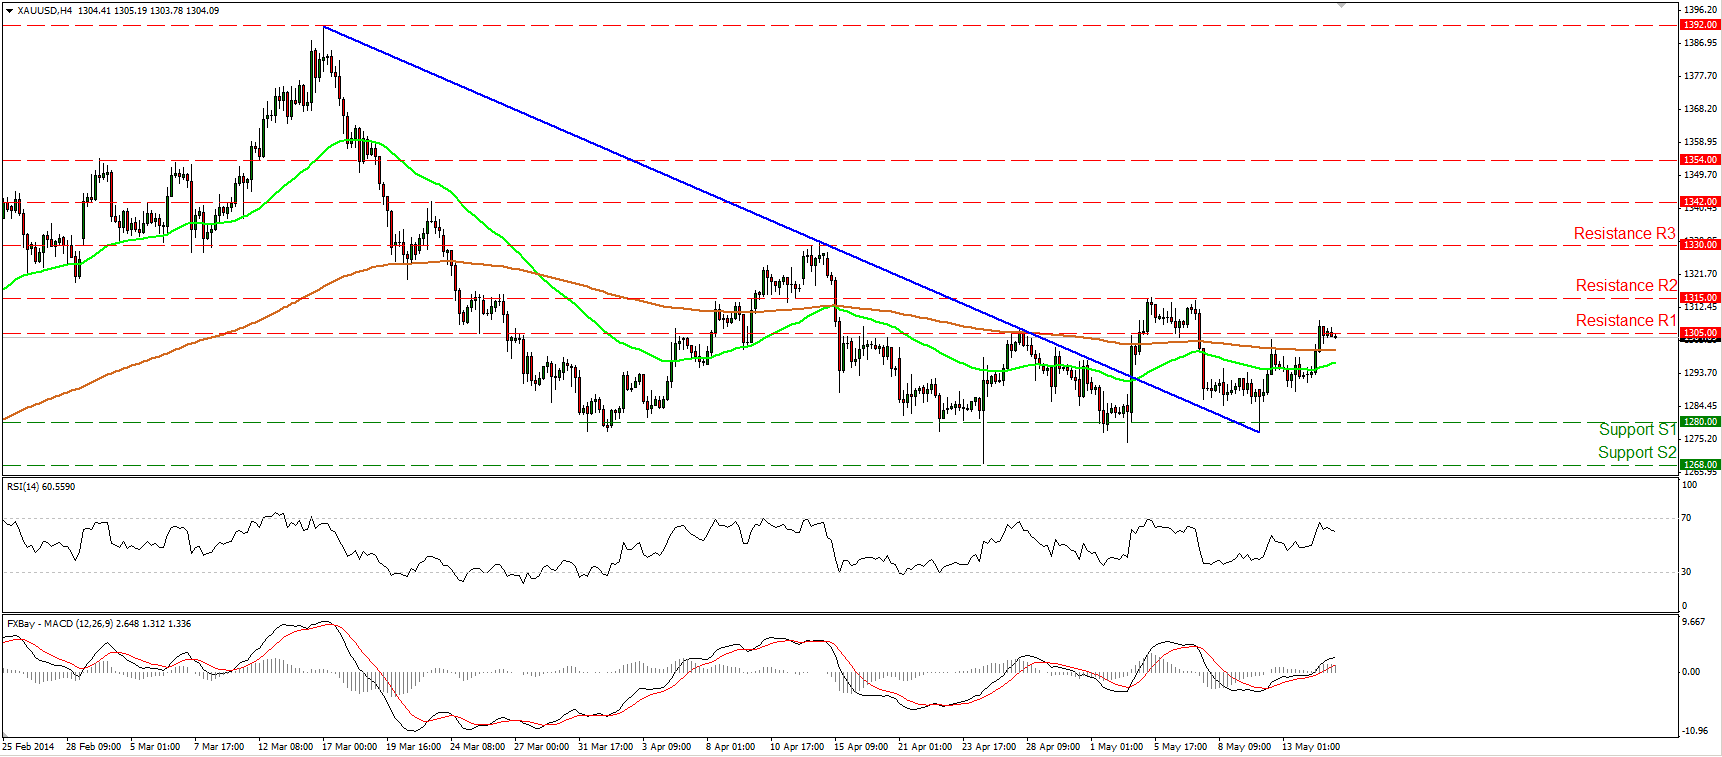
XAU/USD moved higher to challenge the resistance barrier of 1305 (R1). In early European trading the precious metal is consolidating near that level, where a clear upside move may see the next hurdle at 1315 (R2). Nevertheless, I still consider the overall picture of the metal to remain neutral since only a break above the resistance of 1315 (R2) would confirm a forthcoming higher high. This could turn the picture back to the upside and perhaps target the 1330 (R3) hurdle.
• Support: 1280 (S1), 1268 (S2), 1250 (S3).
• Resistance: 1305 (R1), 1315 (R2), 1330 (R3).
Is Oil Ready to Pull Back?
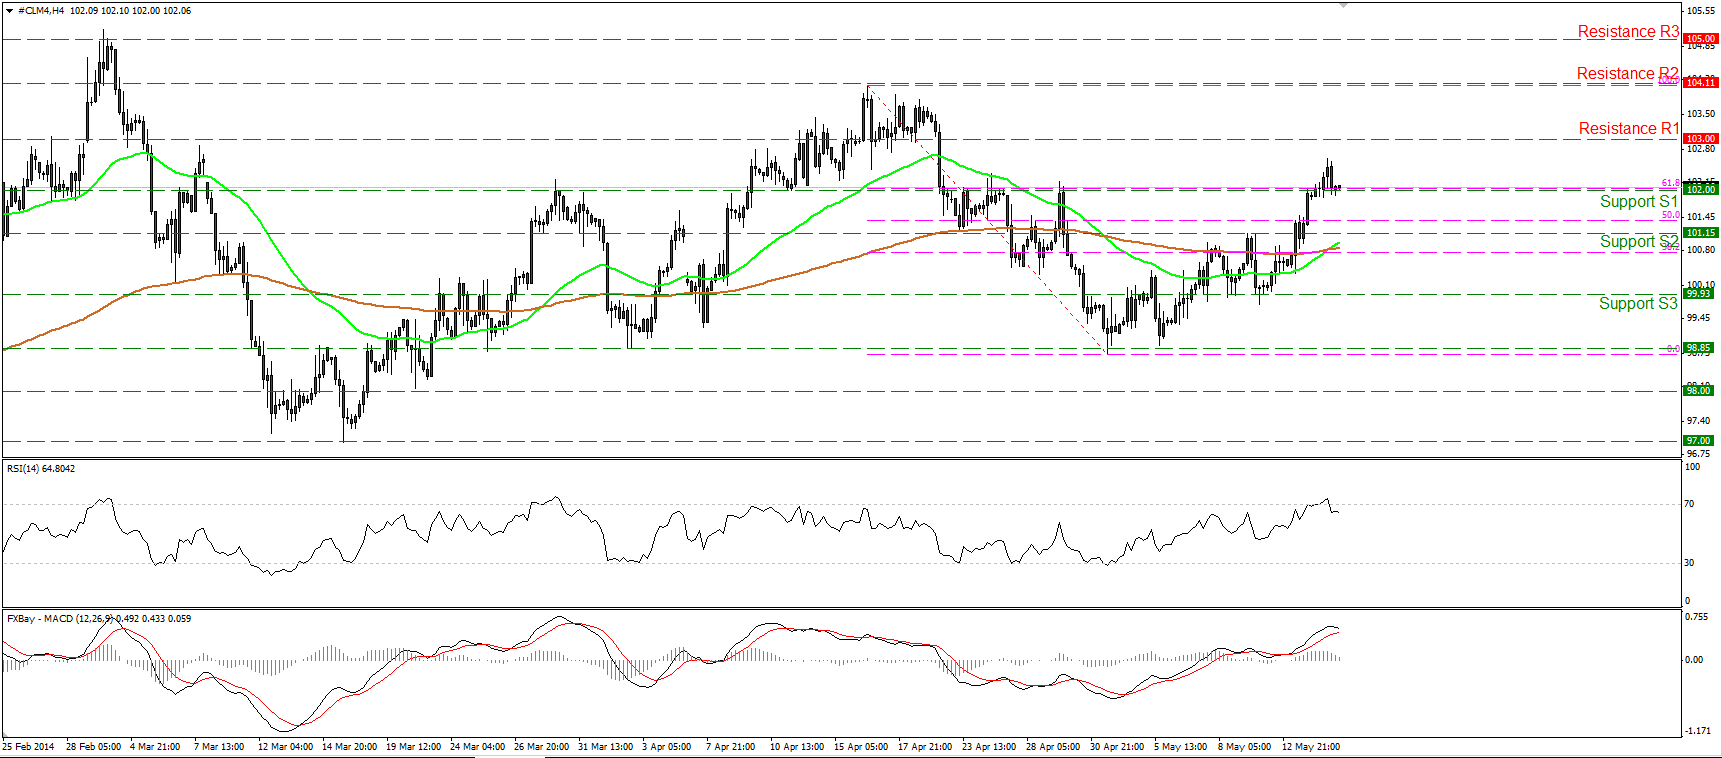
WTI moved above the 102.00 bar, but returned lower to test it as a support. As long as the price is printing higher highs and higher lows above both the moving averages, the short-term picture remains positive and I would expect the bulls to target the 103.00 (R1) resistance in the near future. However, the MACD shows signs of topping, while the RSI exited overbought conditions. Thus we may experience a pullback below 102.00 (S1) before the bulls prevail again.
• Support: 102.00 (S1), 101.15 (S2), 99.85 (S3).
• Resistance: 103.00 (R1), 104.10 (R2), 105.00 (R3).

