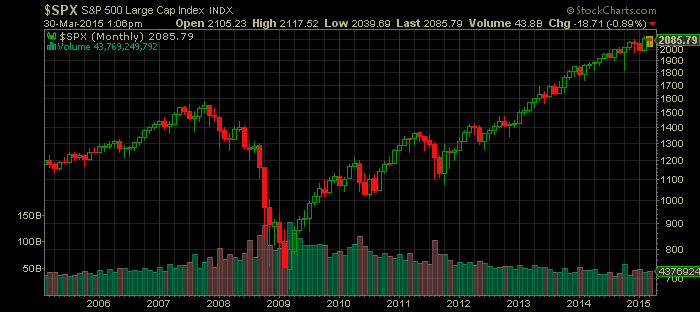
Since the bottom in March 2009, the stock market has been on a tear, climbing 212%. Below is a monthly chart:
The advance has been relentless, and there has been no correction since 2011. Another perspective shows that while the path has been smooth for the S&P 500, it has been rockier for the broader market, especially in recent years.
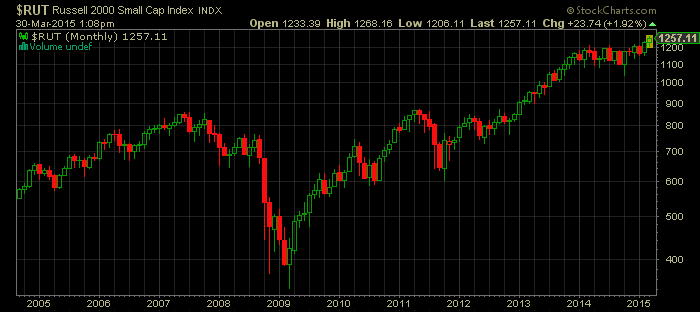
Below is the monthly chart of the small caps index of the Russell 2000:
There was a massive divergence in performance in 2014. Part of the reason was that 2014 was a year in which the economy underperformed expectations. Yields on the ten year note opened the year around 3% and finished the year at 1.75%. This fall in yields came about as the Federal Reserve was marginally tightening monetary policy by tapering QE.
Falling interest rates are bullish for dividend paying, large cap stocks in that they make their dividend more appealing. They are less bullish for the broader economy and small cap stocks who are tied more the Main Street economy than the financial economy. Falling interest rates imply an economy underperforming relative to expectations and lack of inflationary pressures.
Large cap stocks can also take advantage of lower interest rates to fuel share buybacks. While they are hurt by a weak economy, the stock price can appreciate through other means, as long as there is no threat of a recession.
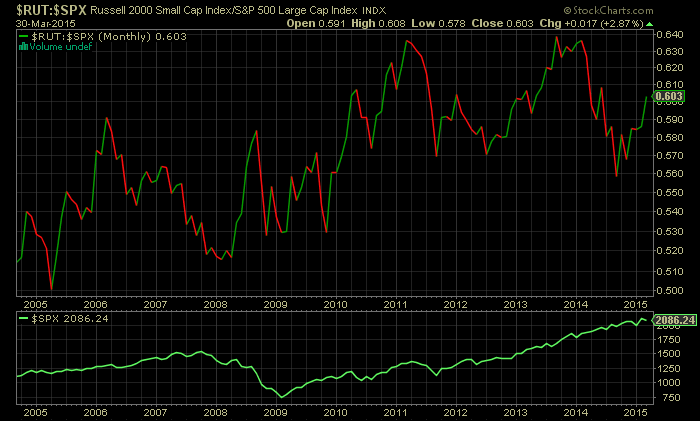
Coming off this underperformance, the small cap stocks have begun outperforming in recent months. Recent economic trends have been favorable. The rising dollar will hurt large cap stocks more than small caps, as they receive a larger share of their revenues from abroad. Small cap stocks will have somewhat of a tailwind due to lower input costs and consumers with more money in their pockets due to lower prices and an improving jobs situation.
As the chart above shows when small caps are outperforming, the odds of a trending bull market are higher in which risk assets outperform. Currently, this is the case as interest rate sensitive areas of the market are lagging while high beta areas of the market are showing strength such as biotechs, social media, and semiconductors.
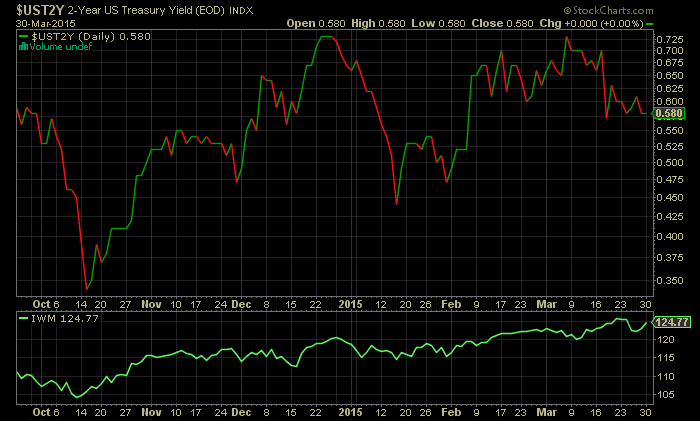
Since October 2014, short term rates have begun to turn around as the Federal Reserve marginally tightens money via interest rate expectations. While everyone is focusing on when the Federal Reserve will exactly raise interest rates, the larger picture is that this is being openly discussed. Even getting to this point implies a tightening of monetary policy via expectations.
So far, stocks have digested this well, and the relationship between stocks and bonds seems to be normalizing with rates and stocks moving together. As the chart of the U.S. 2-Year Treasury Yield shows below.
This is healthy and a good sign for the market, that it can stand on its own legs without quantitative easing. In a QE world, stocks can go up when interest rates are falling, most likely this is not the case in a post QE world.


