Yesterday I discussed the extreme levels of nominal margin debt in the financial markets, which generated a quite extensive list of questions and comments. Many of the comments suggested different methods of analyzing margin debt that I thought I would share with you.
Let's start with yesterday's analysis as a base from which to build.
Margin Debt Strikes New High
"Along with the markets currently being more overbought now than at any other point in history, they are also more leveraged as well.
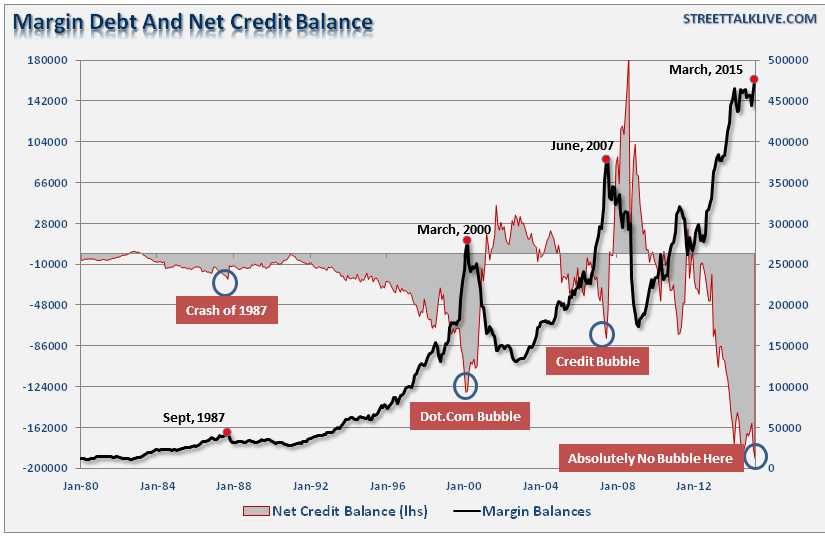
Late last week the NYSE released its latest margin debt figures for March. Despite a rather sluggish market, investors piled on margin debt pushing levels to all-time highs as shown below."
"It is worth noting that when net credit balances have plunged very negative levels it has been coincident with major mean reverting events in the market.
While "this time could certainly be different," the reality is that leverage of this magnitude is "gasoline waiting on a match." When an event eventually occurs, that creates a rush to sell in the markets, the decline in prices will reach a point that triggers an initial round of margin calls. Since margin debt is a function of the value of the underlying "collateral," the forced sale of assets will reduce the value of the collateral further triggering further margin calls. Those margin calls will trigger more selling forcing more margin calls, so forth and so on.
Notice in the chart above that margin debt reductions begins innocently enough before accelerating sharply to the downside."
Margin Debt To GDP
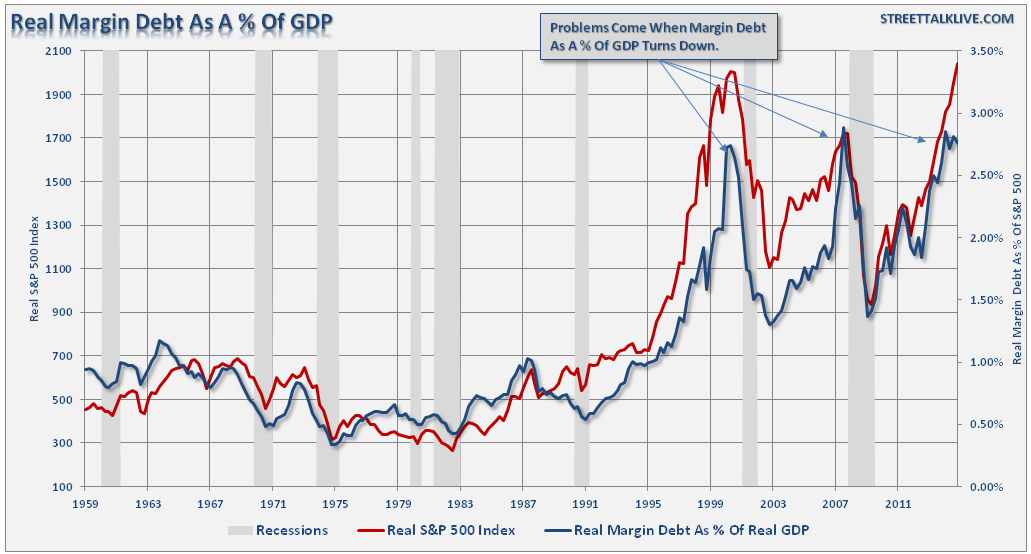
I received several emails suggesting a view of margin debt to the economy as measured by GDP. The idea is that since the stock market should be somewhat reflective of underlying economic activity, then the correlation between the markets, leverage, and economic growth should provide some clues as to future outcomes.
As suggested by several readers, there is a high degree of correlation between the markets and margin debt as a percentage of GDP (all inflation adjusted). However, as noted, it is when margin debt as a percentage of GDP begins to decline that has previously marked peaks in market expansions.
Margin Debt To Market Capitalization
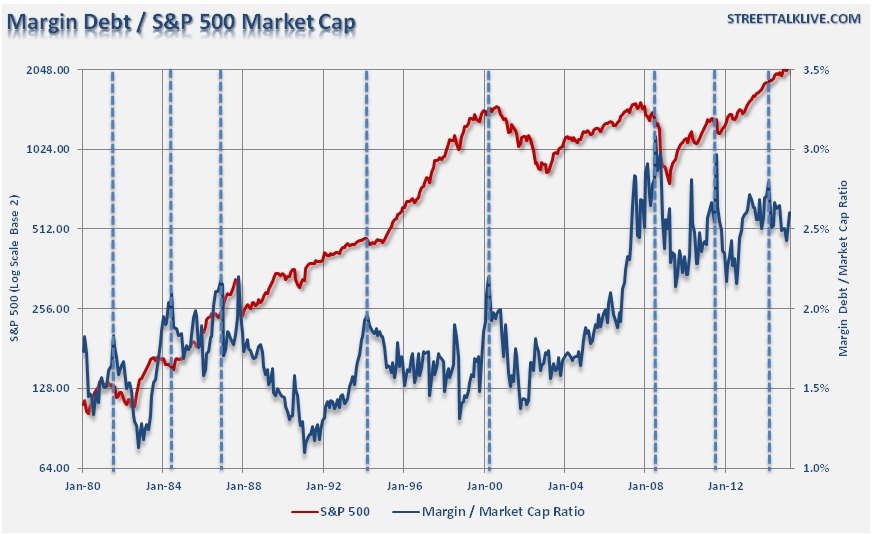
Margin debt to market capitalization was also widely suggested by readers. The chart below shows the S&P 500 and the Margin Debt/Market Capitalization ratio.
Spikes in the margin debt to market capitalization ratio have been historically consistent with short-term market peaks and the beginning of major corrections. While the recent spike higher did not trigger a significant correction, the markets did stagnate during the first few months of the year. This indicator will be worth watching as we head into the seasonally weak summer months.
Technical Analysis Of Margin Debt
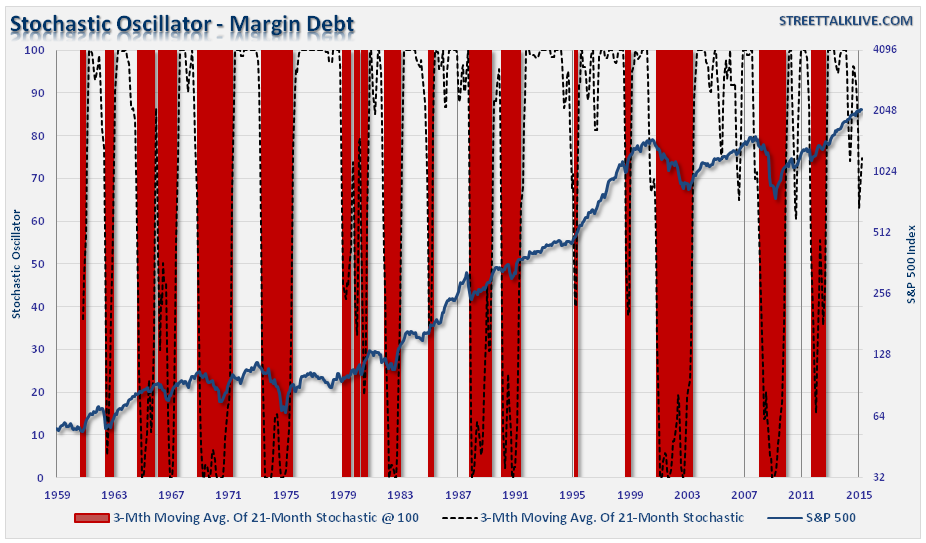
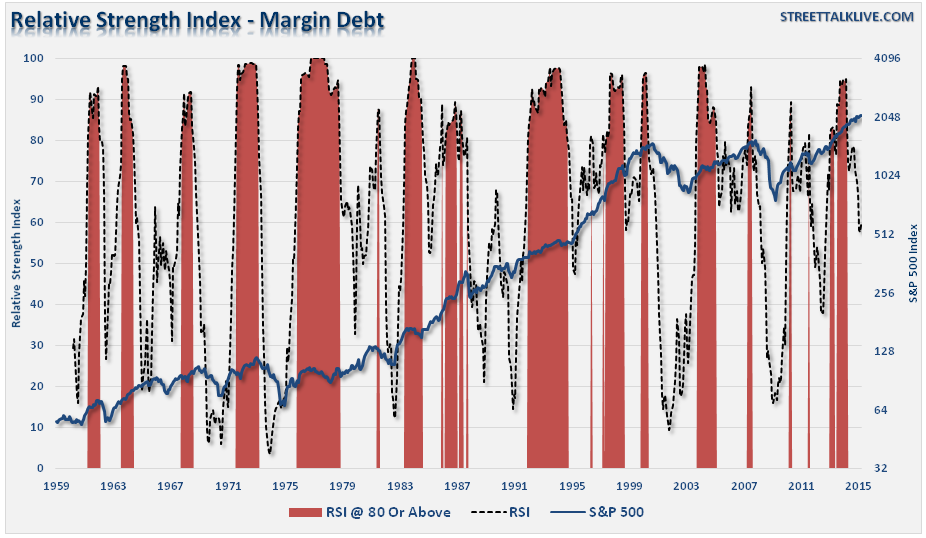
While more esoteric measures of margin debt are certainly interesting and can tell us much about the macro relationships, it is the more raw technical analysis that can be more useful in the shorter term. The following three charts examine more technical aspect of margin debt as it relates to the financial markets -- the 12-month moving average, relative strength and stochastics.
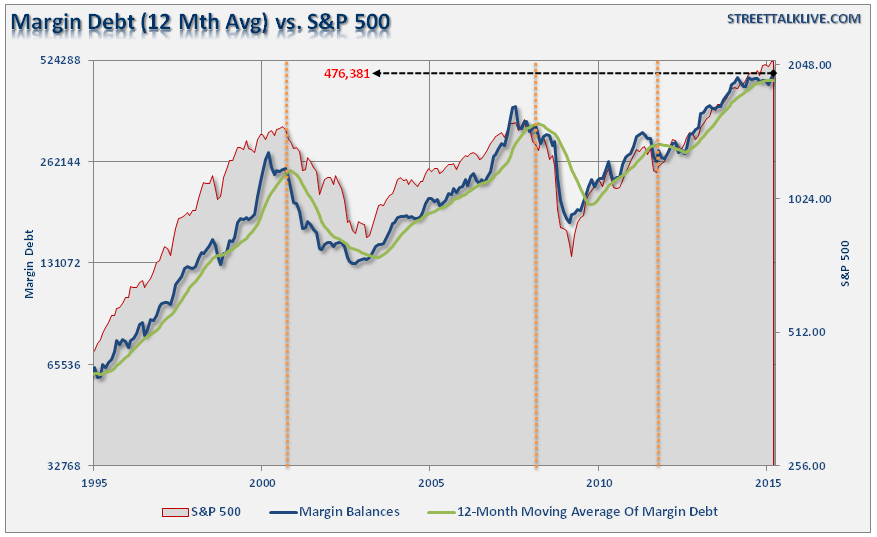
The first is the 12-month moving average of margin debt. When margin debt has fallen below the 12-month moving average, it has been indicative of market corrections. In February, margin debt did dip below its 12-month average, however, that was quickly reversed in March with the sharp jump in leverage.
The next chart is a Stochastic Oscillator of margin debt. The vertical red bars highlight when the oscillator has declined below 50 on a scale of 0 to 100. As with margin debt itself, it is not the increase of the oscillator that is important but rather the decline. When the oscillator falls BELOW 50 and approaches ZERO is when the markets have either been in short-term corrections or full blown reversions. The recent decline in the oscillator, which has not fallen below 50 as of yet, is worth paying attention to.
Another interesting suggestion was to apply a relative strength index to margin debt. As discussed above, when margin debt is rising strongly, so are the markets. Conversely, when market participants become worried about the markets and begin to unwind leverage, which requires selling, that markets have historically run into trouble.
It is when margin debt's RSI has exceeded 80, and then began to decline, that has generally been indicative of short-term corrections or major market declines. What is interesting is that the RSI recently peaked above 80, the market has not yet yielded even a modest short-term correction. Does this mean the indicator is flawed and should not be paid attention to? Hardly. What it does suggest is that much like the late 90's, exuberance is pressing stocks higher even as many of the underlying technical and fundamental indicators suggest this should not be the case.
Conclusion
These different measures of margin debt, as recommended by readers of yesterday's commentary, all suggest that investors should be cautious of the markets currently. While the bullish trend currently remains intact, as stated recently, it doesn't mean that investors should become overly complacent. Risks of a more substantial correction have risen due to a deterioration in economic data, fundamental data and the length of time itself.
Currently, margin debt is still rising as the "fear of missing out" on potential upside in the market is trumping longer-term logic of risk management and portfolio controls. However, this has always been the case with investors historically as the chase for returns leads to "buying tops" and "selling bottoms." This time will very likely turn out similarly.
The important thing to remember about margin debt is that alone it is inert and poses no real danger to the market. However, when combined with the correct catalyst, it will act as an accelerant to a market correction when forced liquidations fuel additional selling.
Few investors have survived the corrections that in hindsight were deemed "obvious." However, in the short-term, these dangers remain dismissed as the markets continue to climb a "wall of worry." But that is a climb that does not last forever.

