Equities
- Recent AAII survey readings came in at 41% bulls and 27% bears. Since the last report in early February, AAII readings have recovered back towards neutral levels. Averaged over four weeks or one month to remove volatility, AAII sentiment still continues to remain elevated. Interestingly, the last time this indicator reached oversold levels was all the way back in June 2013, almost a year ago. Since all markets and indicators eventually mean revert, we should expect that the current confidence in the retail investment community will not last forever… it never does.
Chart 1: Newsletter advisors remain stubbornly bullish at extreme levels
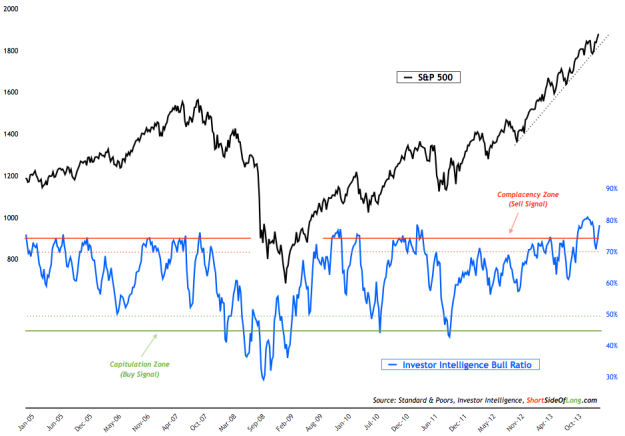
- Recent Investor Intelligence survey levels came in at 55% bulls and 15% bears. While the bullish readings pulled back during the January correction and now returned back close to elevated levels once, bearish readings remained at extreme complacency all along. it is as if investors refuse to turn bearish at any sign of a sell off. The chart above shows that the II Bull Ratio is once again at dangerously high levels, where previous intermediate peaks have occurred. Caution is advised.
- Recent NAAIM survey levels came in at 89% net long exposure, while this week's intensity was at a whopping 177%, with even the most bearish of managers in the survey holding a net long position (a rare occurrence usually found near market tops). While this indicator experienced a sharp fall in bullish sentiment during the January correction, similar to II Bull Ratio, it has also recovered to elevated levels in only a handful of weeks. The two month moving average of net long exposure still sits above 80%, a similar level to the May 2011 stock market top.
Chart 2: We are now registering a 15th monthly equity inflow in the row!
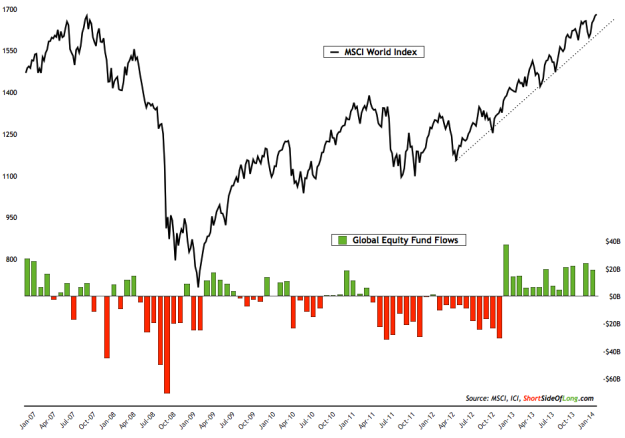
- Recent ICI fund flows reports showed that “equity funds had estimated inflows of $4.96 billion for the week, compared to estimated inflows of $5.83 billion in the previous week. Domestic equity funds had estimated inflows of $3.11 billion, while estimated inflows to world equity funds were $1.85 billion.” On the other hand, the recent report from Bloomberg show that Emerging Markets continue to experience outflows, with Europe the main destination for the hot money:
Withdrawals from U.S.-based ETFs investing in emerging-market equities and bonds totaled $11.3 billion this year, already surpassing the redemption of $8.8 billion for the whole of 2013, according to data compiled by Bloomberg. Funds investing in European assets added $5 billion in the first two months of 2014, compared with $18 billion full-year inflows in 2013.
Returns in emerging-market stocks this year are trailing their European peers the most since 2011 as China’s economy slowed, currencies from Turkey to South Africa tumbled while violent protests in Ukraine fueled geopolitical tension. In Europe, economic confidence increased for a ninth month in January, suggesting the scars from the ravages of the sovereign-debt crisis in 2011 are healing.
- Recent Rydex fund flows still continue to remain at extremely bullish levels. Rydex traders, usually considered as dumb money, are still pilling into US equities at levels not seen since the great Tech Bubble burst in late 1999/2000 period. Investors who are interesting in seeing the short term as well as the long term chart, should click here and here for the links. As you can see, there is no doubt about the fact that Rydex traders are completely swept away by the bullish market trend and in full speculation mode.
Chart 3: Hedge funds building long exposure towards extremes again…
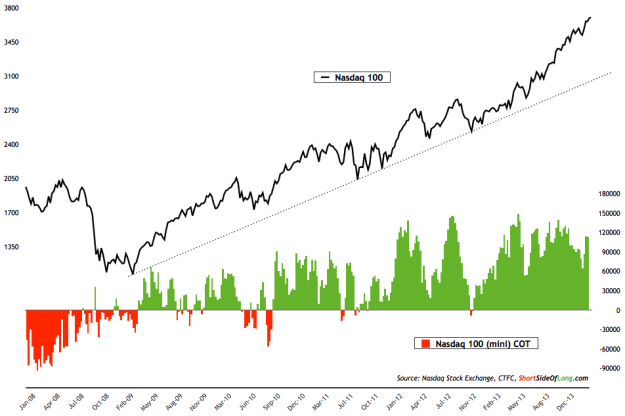
- Recent commitment of traders reports (also known as dumb money) showed that speculators have not been shaken out during the January correction and have once again started to build their stock exposure towards extremes. Hedge funds and other speculators currently hold over 113,000 net long contracts, which is a substantial increase from 63,800 we saw during middle of February. As can be seen in the chart above, when contracts increase above 110,000 net longs, usually a pullback or a correction follows. Investors should also note that the last time we saw hedge funds collectively hold a net short positions, was all the way back in November 2012. In other words, it has been a long time since futures traders have been bearish.
Chart 4: Volatility Index (VIX) has finally broken out to the upside!
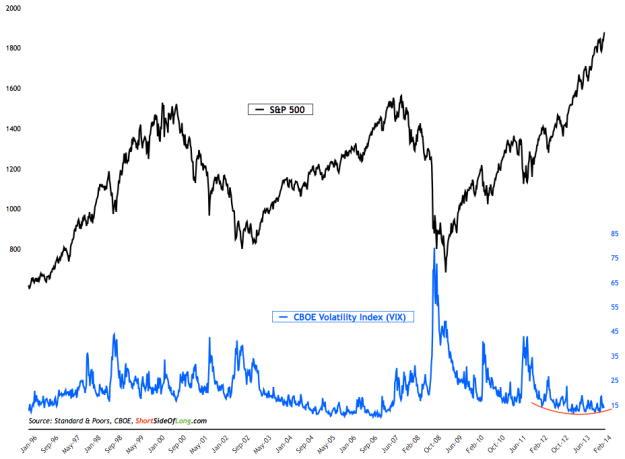
- Long term volatility conditions can be seen by looking at the chart above. Any investor should be able to make a observation that during the initial stages of the bull market, volatility was constantly high. We went through a 2010 flash crash and 2011 crash. While it was difficult to read it at the time, this was the wall of worry testing investors nerves. However since late 2012, volatility has completely died down and conditions have turned “calm”. This is usually what the last part of the bull market looks like; where greed, speculation and complacency take over the wall of worry.
- Also worthy of note are other indicators such as the Skew Index, Corporate Bond & Junk Bond Credit Spreads, Corporate Bond Credit Default Swaps and 2 Year Dollar & Euro Swap Rates, all of which remain at complacent levels like the VIX (thanks to Scott Grannis’ blog for majority of the Bloomberg charts). With Fed continuing its taper, it is only a matter of time until volatility increases, especially since the positive seasonally ends in April and most sell offs occur in the fall. Once again caution is advised.
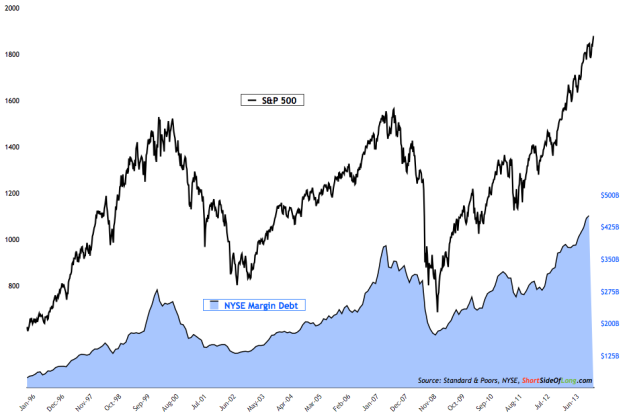
- According to NYSE, Margin Debt (measure of investor leverage) climbed to yet another record high in January 2014. Official nominal margin debt readings now stands at $451.3 billion, climbing by over $6.3 billion in a month. Margin debt, adjusted for inflation (if we can actually trust those government figures) currently stands at a record high as well, exceeding both the 2000 and 2007 peaks. Margin debt relative to the current US GDP is near its record highs too, as can be seen from this chart. Finally, investor credit balance is also at record lows, confirming that excessive speculation with leverage is alive and well.
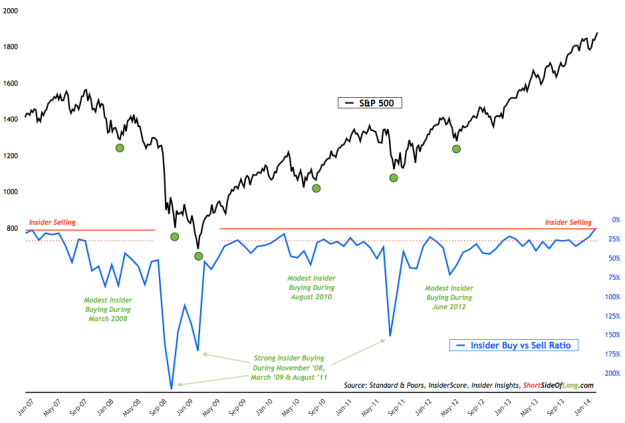
- Corporate Insider activity (also known as smart money) shows that net selling has been increasing over the recent months. Corporate insiders have one of the most impeccable timing records out of all markets participants (that is why this group has earned the nickname “smart money”). As we can see in the chart above, over the last several years, Corporate Insiders have managed to time intermediate bottoms in March 2008, November 2008, March 2009, August 2010, August 2011 and June 2012. Not bad at all! At the same time, they have also been strong sellers during recent market peaks. The continuous selling by insiders is a warning signal of a possible market correction ahead. I know I sound like a broken record, but… once again caution is advised.
Bonds
- Relative to the last report in early February, Bond sentiment surveys continued to rise higher towards the neutral level over the last several weeks. Market Vane Bullish Percentage increased above 55% bulls and towards a neutral level. Consensus Inc survey increased even further above its mean level, with readings now close to 55% bulls as well. Neither of these surveys are anywhere near extreme optimism. February report of the Merrill Lynch Fund Manager Survey showed that exposure towards bonds still remains quite negative, but has moved out of the “extreme” pessimism” zone.
Chart 7: Traders started adding some capital towards fixed income again
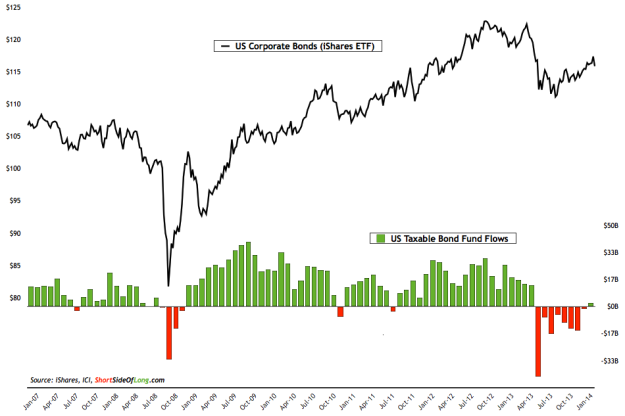
- Recent ICI fund flows reports showed that “bond funds had estimated inflows of $2.33 billion, compared to estimated inflows of $2.91 billion during the previous week. Taxable bond funds saw estimated inflows of $1.66 billion, while municipal bond funds had estimated inflows of $667 million.” Bond funds are currently in the process of establishing a first monthly inflow, after eight consecutive monthly outflows. With the majority of selling and outflows occurring in May and June of last year (Bernanke’s hint of Fed Taper), investor panic once again marked an intermediate degree bottom for the corporate bond market. However, the rally has lagged equities without a new high confirmation and looks quite weak.
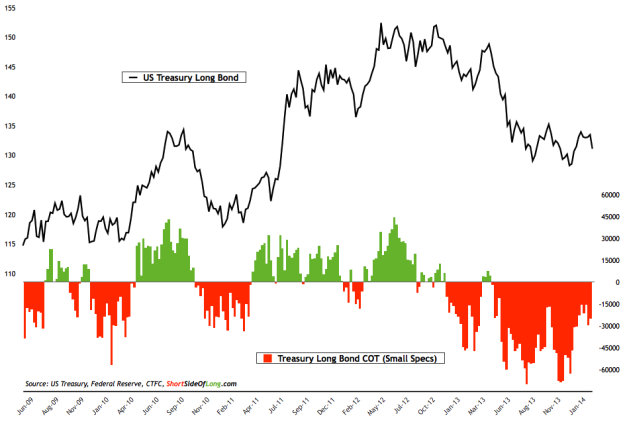
Chart 8: Speculators now hold mild net short bets on Treasury Bonds
-
Recent commitment of traders report (also known as dumb money) shows that small speculators have stopped closing out their net short contracts. It seems that the short squeeze has either taken a breather or has completely stopped. The latest report released on Friday showed that net short bets remain just shy of -25,000 contracts. Comparing the current level to that of early December 2013, when contracts stood close to -69,000, demonstrates that almost 66% of the bearish bets have already been closed. Interestingly, so far the Long Bond has merely moved sideways, with a resistance at 135 holding any rally attempts.
Commodities
Chart 9: Hedge funds turn bullish on commodities as they chase the rally
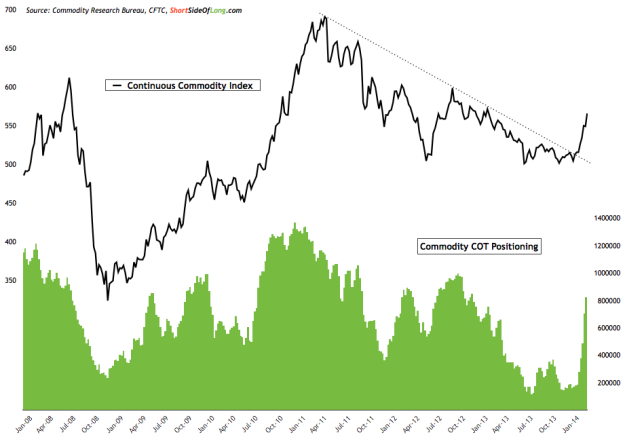
- In the early February sentiment report, I concluded that hedge fund exposure to commodities remained quite depressed. It is amazing what can happen in a month. The recent commitment of traders reports (also known as dumb money) showed that hedge funds and other speculators are now turning very bullish towards the overall commodity complex, with exposure reaching over 820,000 net long contracts (custom COT). Please note that positioning stood at 160,000 net long contracts in early January of this year. Majority of the net long contract building has come from Agricultural sector, where weather effects have pushed prices higher.
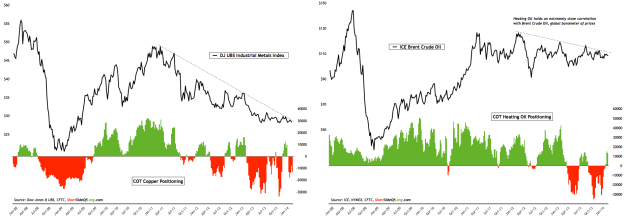
Chart 10: Industrial commodities aren’t confirming the breakout yet…
-
Despite the technical commodity breakout, various industrial and economically sensitive components of the index are not confirming the rally (…just yet). Chart 9 shows that industrial metals, lead by Copper, have been in a decline for over 3 years and have not yet managed to break out of their respective downtrends. As I write this report, Copper has been in a short term free fall and now trades at its major support of $3.00 per pound. At the same time, over the last 3 years, Brent Crude Oil has been trading sideways with an average price of $110 per barrel. Despite a large build up in net short positions over 2013, both of these commodities have failed to rally. To validate the recent raw material uptrend, both of these commodities definitely need to break out and join the party.
Currencies
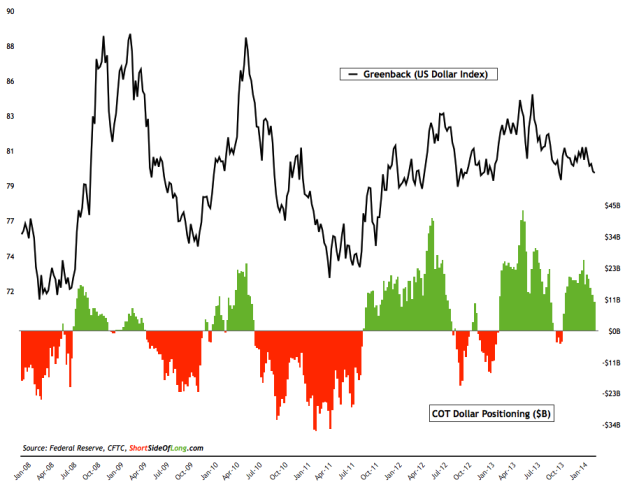
Chart 11: Hedge funds continue to reduce exposure towards the USD!
-
Recent commitment of traders reports (also known as dumb money) have shown a gradual decrease in bullish positioning towards the US Dollar. During the last report (early February), cumulative G10 positioning by hedge funds and other speculators stood at $20 billion worth of net long contracts. This figure has now been reduced by half, towards $10.3 billion net longs. Hedge funds remain mixed in the G10 currency complex as they continue to favour European continent currencies such as the Euro, the Pound and the Franc; while still disliking commodity related currencies such as the Aussie and the Loonie. Finally, Japanese Yen still holds the largest net short position (almost $10 billion), despite a recent mini-short-squeeze.
Chart 12: British Pound’s sentiment continues to remain very elevated
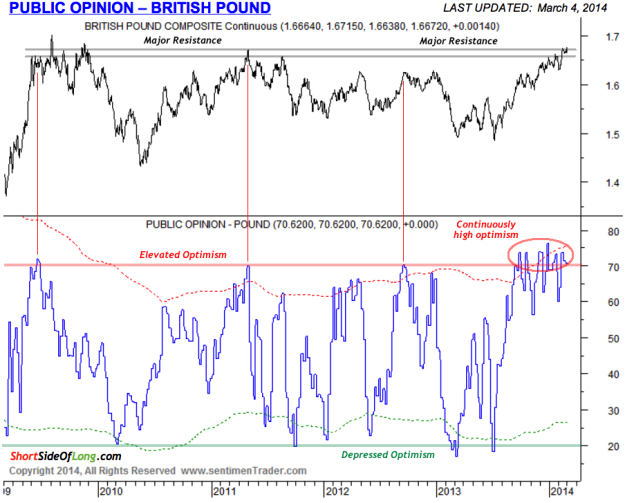
- Currency sentiment survey readings on the US Dollar remain neutral, giving a contrarian trader neither the bullish nor the bearish signal. However, various G10 currencies are experiencing opposite ends of the investor mood. Sentiment continues to be bearish on the commodity currency complex (confirming the COT report), while bulls are now running with the European currencies (some of which were incredibly hated only 6 months ago). The chart above shows a huge cluster of optimism towards the British Pound, as the currency finds itself at a major resistance zone. SentimenTrader summarises the current conditions well, stating:
…the Public Opinion data is showing that investors have been bullish on the pound for an extended period of time. We haven’t really seen any big jumps in bullishness; it’s just that it has been very high for a very long time.
… [6 month sentiment average] is nearing 70% for only the third time since 1991. The other two times, the pound wasn’t able to make much headway. This is curious given the pound’s relatively muted rally over the past six months compared to what we’d seen the other times.
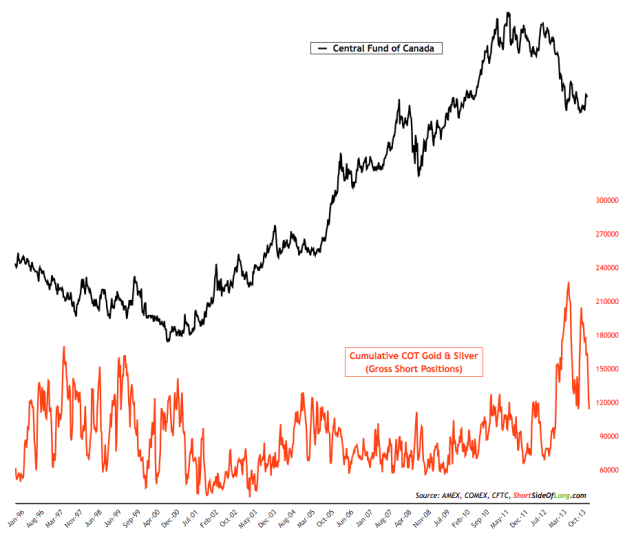
Chart 13: PMs short squeeze on bearish hedge funds has been in play!
-
Recent commitment of traders reports (also known as dumb money) showed hedge funds and other speculators jumping into a Precious Metals rally, with majority of the short bets now being closed out (refer to chart above). Aggregate positioning in both Gold and Silver continues to increase from the early February report, with hedge funds now holding over 160,000 net long contracts. If we compare the current positioning to that of early December 2013, when total net long contracts stood at only 35,000, we have seen exposure rise by 4.5 times. Having said that, the important point to make here is that since early December, hedge funds have decreased their gross shorts by almost 50% (chart above); while gross longs have only been increased by around 15%. In other words, this is a short squeeze as there is very little buying going on as of now.
Chart 14: Miners are recovering, but have become short term overbought
-
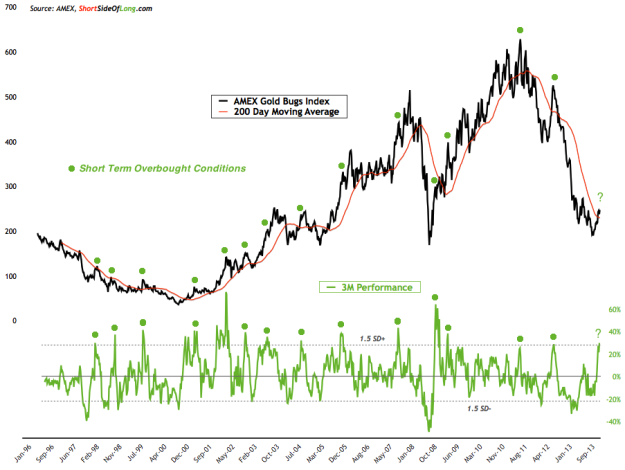
Precious metals sentiment survey readings have rebounded from the bearish we saw during the last couple of months in 2013. Gold and Silver sentiment is currently neutral right around the 50% mark, while Platinum has seen a full recover as investors turn more optimistic. Overall, the Precious Metals sector has been through a recovery in the last quarter, with some assets doing better then others (miners have out-performed, Silver has under-performed). The chart above, together with this blog post, shows that Gold Miners have now become overbought from the short term perspective. Over the last two decades, there were 14 instances of similar overbought readings and interestingly 10 out of the 14 marked an automatic short term top and a pull back of at least 10% (sometimes much more). Therefore, caution is advised.

