
The Q1 reporting cycle really heats up this week, with more than 900 companies reporting results, including 183 S&P 500 members. By the end of this week, we will have seen results from more than 60% of the index’s total membership. But with a representative-enough sample of earnings reports already out, we have a good sense of how this reporting cycle has unfolded.
The trend thus far from the 132 S&P 500 members that have reported Q1 results is of more numerous positive earnings and revenue surprises and fewer negative revisions to current-quarter estimates. This seemingly favorable development notwithstanding, the growth challenge remains, with Q1 earnings on track to be below the year-earlier period, the 4th quarter in a row of earnings declines.
It is perhaps not surprising to see a bigger proportion of companies beat estimates given how low estimates had fallen ahead of the start of this reporting cycle. But the deceleration in negative estimate revisions could be a positive development on the earnings front, provided it continues through the coming days. Please note that estimates for the current period (2016 Q2) are still coming down and the trend will likely accelerate in the coming days as more companies report Q1 results and provide guidance about Q2. But the pace and magnitude of negative revisions at this stage is tracking below what we had seen in the comparable period in the preceding earnings cycle. A continuation of this decelerating negative revisions trend through the coming days will represent a notable improvement in the overall corporate earnings picture, which has largely been negative for some time.
More on the aggregate earnings picture emerging from the already-released Q1 results a little later, but let’s briefly touch on the Tech sector’s results following the recent weaker than expected reports from Microsoft (NASDAQ:MSFT) (MSFT) and Google’s parent Alphabet (GOOGL). Both of these companies didn’t rise to the expectations that had built up following their blowout results in the preceding earnings season. In other words, the Microsoft and Google (NASDAQ:GOOGL) disappointments are the inverse of what is happening this earnings season as a whole, with low expectations providing an easy-to-beat hurdle rate for most companies.
Including these Tech sector reports, we have Q1 results from 49.6% of the sector’s total market capitalization in the S&P 500 index. Total earnings for these Tech companies are down -6% on -1% lower revenues, with 72.2% beating EPS estimates and 50% beating revenue estimates. This is weak performance from these Tech companies relative to what we have seen from the same group of companies in other recent periods, as the charts below show.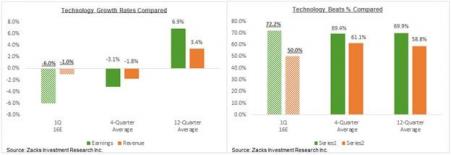
For the Tech sector as a whole, total Q1 earnings are expected to down -5.8% on +2.3% higher revenues. Apple (NASDAQ:AAPL) (AAPL), which reports Q1 results this week, is a drag on the sector’s growth picture, with total earnings for the iPhone maker expected to be down -19.7% from the same period last year on -9.9% lower revenues. Excluding Apple, total Tech sector earnings for the quarter would be down -1.3%.
Q1 Earnings Scorecard
As of Friday, April 22nd, we have Q1 results from 132 S&P 500 members that combined account for 37.3% of the index’s total market capitalization. Total earnings for these index members are down -7.9% from the same period last year on -1.1% lower revenues, with 77.3% beating EPS estimates and 56.1% beating revenue estimates. The percentage of companies that are able to beat both EPS and revenue estimates is tracking 48.5% at this stage.
The table below shows the current scorecard for these companies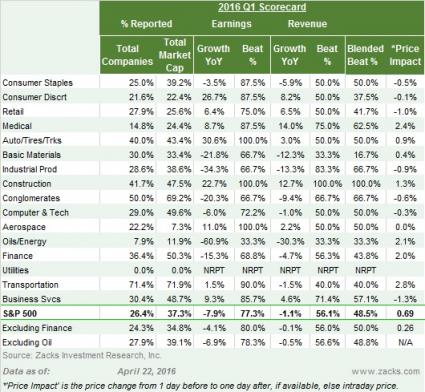
The charts below compare the results thus far with what we have been seeing from the same group of 132 index members in other recent periods.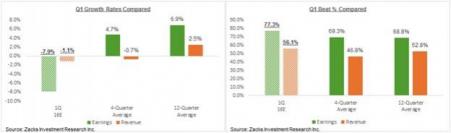
The above comparisons show that while the growth pace for these 132 S&P 500 members is notably below what we have been seeing in other recent periods, the picture is totally different with respect to positive surprises. Positive surprises are tracking better than the 4-quarter and 12-quarter averages.
This incidence of more numerous positive surprises is visible in the ‘blended’ beats comparisons as well; ‘blended beats’ refer to companies that beat both revenues as well EPS estimates. At present, 48.5% of the 132 S&P 500 members that have reported results are beating both EPS and revenue estimates, which is better than what we saw from the same group of companies in the preceding quarter as well as the 4-quarter and 12-quarter averages.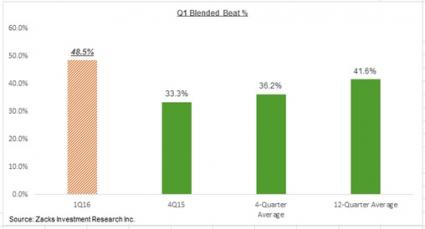
The more numerous positive surprises most likely reflects that estimates fell more than they needed to ahead of the start of this earnings season. You would recall that Q1 estimates had fallen the most of any other recent periods.
Q1 Estimates As a Whole
Combining the actual results from the 132 S&P 500 members that have reported results with estimates for the still-to-come 368 members, total Q1 earnings are currently expected to be down -9.4% from the same period last year on -0.8% lower revenues. This will be the 4th quarter in a row of earnings declines for the index.
Energy is the big drag in Q1, as it has been in other recent periods, with total earnings for the sector expected to be down -110.4% from the same period last year on -29.7% lower revenues. Excluding the Energy sector, earnings growth for the remainder of the index would still be in the negative – down -4.1%. In total, 9 of the 16 Zacks sectors are on track for negative earnings growth in Q1, including Finance and Technology, the two biggest sectors in the index.
The table below presents the summary picture for 2016 Q1 contrasted with what companies actually reported in the 2015 Q4 earnings season.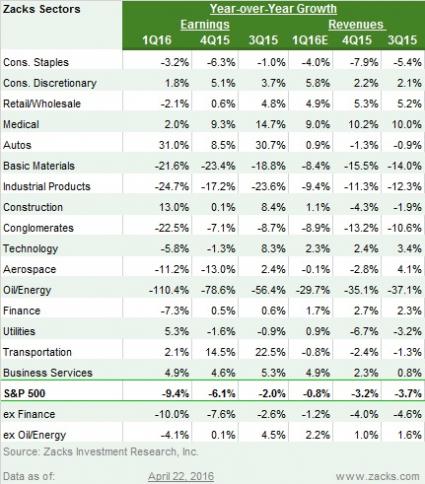
The chart below shows current quarterly earnings growth expectations for the index in 2016 Q1 and the following four quarters contrasted with actual declines in the preceding three quarters. As you can see, growth is expected to be negative in 2016 Q2 and barely in positive territory in the following quarter.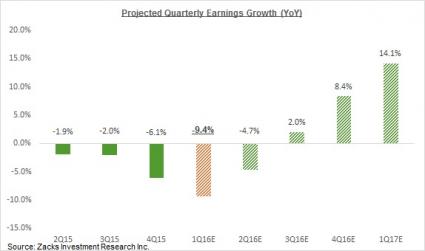
This Week’s Key Reports
We have more than 900 companies reporting results this week, including 183 S&P 500 members. The chart below shows the weekly calendar of Q1 earnings reports for the S&P 500 index.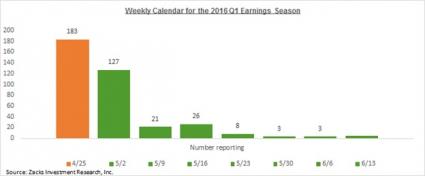
Here are this week’s key earnings reports
Monday (4/25): Halliburton (HAL) is notable among the 8 S&P 500 members coming out with results on Monday.
Tuesday (4/26): On a very busy reporting docket with 53 S&P 500 members reporting results (28 before the market’s open), the notable reports are from DuPont (NYSE:DD) (DD), 3M (MMM) and Eli Lilly (LLY) in the morning and from Apple (AAPL), Twitter (TWTR) and Chipotle (CMG) after the close.
Wednesday (4/27): Of the 23 S&P 500 members reporting before the market’s open today, the notable ones remain Boeing (NYSE:BA) (BA) and Comcast (NASDAQ:CMCSA) (CMCSA), while Facebook (NASDAQ:FB) (FB) and PayPal (PYPL) are among the 19 reporting after the close.
Thursday (4/28): On a busy reporting day with 43 S&P 500 members reporting before the market’s open, the notable reports are Ford (F), MasterCard (MA) and ConocoPhillips (NYSE:COP) (COP). Amazon (NASDAQ:AMZN) (AMZN), Gilead (GILD) and Expedia (NASDAQ:EXPE) (EXPE) are the notable of the 18 index members reporting after the close today.
Friday (4/29): Exxon (NYSE:XOM) (XOM) and Chevron (NYSE:CVX) (CVX) are the notable among the 20 index members reporting today, all in the morning.
Note: Want more articles from this author? Scroll up to the top of this article and click the FOLLOW AUTHOR button to get an email each time a new article is published.
Note: For a complete analysis of 2016 Q1 estimates, please check out weekly Earnings Trends report.
Here is a list of the 915 companies reporting this week, including 183 S&P 500 members.
| Company | Ticker | Current Qtr | Year-Ago Qtr | Last EPS Surprise % | Report Day | Time |
| HALLIBURTON CO | HAL | 0.05 | 0.49 | 29.17% | Monday | BTO |
| LABORATORY CP | LH | 1.96 | 1.73 | -0.50% | Monday | BTO |
| ROPER INDS INC | ROP | 1.46 | 1.55 | -2.15% | Monday | BTO |
| XEROX CORP | XRX | 0.23 | 0.21 | 10.34% | Monday | BTO |
| CONTROLADORA VL | VLRS | 0.28 | 0.2 | 15.15% | Monday | BTO |
| KKR & CO LP | KKR | -0.3 | 0.62 | -68.00% | Monday | BTO |
| PRECISION DRILL | PDS | -0.13 | 0.07 | 63.64% | Monday | BTO |
| FIRST DATA CORP | FDC | 0.09 | N/A | -141.18% | Monday | BTO |
| POPULAR INC | BPOP | 0.8 | 0.86 | 3.26% | Monday | BTO |
| J&J SNACK FOODS | JJSF | 0.79 | 0.78 | 3.13% | Monday | BTO |
| CHANGYOU.COM | CYOU | 0.55 | 0.91 | 35.19% | Monday | BTO |
| INDEP BK MICH | IBCP | 0.21 | 0.16 | 13.64% | Monday | BTO |
| OPUS BANK | OPB | 0.58 | 0.34 | -13.79% | Monday | BTO |
| BANK OF HAWAII | BOH | 1 | 0.97 | 6.45% | Monday | BTO |
| BANK OF MARIN | BMRC | 0.78 | 0.74 | 3.85% | Monday | BTO |
| COMMNTY BK SYS | CBU | 0.55 | 0.54 | -5.08% | Monday | BTO |
| TENNANT CO | TNC | 0.25 | 0.27 | -2.50% | Monday | BTO |
| FIRST FOUNDATN | FFWM | 0.24 | 0.32 | 32.14% | Monday | BTO |
| KONINKLIJKE PHL | PHG | N/A | 0.2 | -15.63% | Monday | BTO |
| PIONEER NAT RES | PXD | -0.77 | -0.03 | 52.63% | Monday | AMC |
| EXPRESS SCRIPTS | ESRX | 1.23 | 1.1 | 0.65% | Monday | AMC |
| ZIONS BANCORP | ZION | 0.39 | 0.37 | 4.88% | Monday | AMC |
| UDR INC | UDR | 0.43 | 0.43 | 0.00% | Monday | AMC |
| CDN NATL RY CO | CNI | 0.68 | 0.7 | 8.64% | Monday | AMC |
| HOMESTREET INC | HMST | 0.3 | 0.67 | 34.48% | Monday | AMC |
| CRANE CO | CR | 0.87 | 0.92 | 1.82% | Monday | AMC |
| EVEREST RE LTD | RE | 5.62 | 7.34 | 50.46% | Monday | AMC |
| ARTISAN PTNR AM | APAM | 0.52 | 0.65 | -1.56% | Monday | AMC |
| FIRST BNCRP P R | FBP | 0.08 | 0.12 | -12.50% | Monday | AMC |
| NABORS IND | NBR | -0.33 | 0.2 | 18.52% | Monday | AMC |
| ALLISON TRANSMN | ALSN | 0.57 | 0.83 | 33.33% | Monday | AMC |
| HEALTHCARE TRST | HTA | 0.4 | 0.37 | -2.50% | Monday | AMC |
| BANNER CORP | BANR | 0.64 | 0.68 | -21.92% | Monday | AMC |
| ETHAN ALLEN INT | ETH | 0.32 | 0.18 | 27.91% | Monday | AMC |
| FIRST INTST MT | FIBK | 0.51 | 0.46 | 0.00% | Monday | AMC |
| HEALTHSTREAM | HSTM | 0.07 | 0.11 | 66.67% | Monday | AMC |
| MKS INSTRUMENTS | MKSI | 0.33 | 0.66 | 25.93% | Monday | AMC |
| NXP SEMICONDUCT | NXPI | 0.83 | 1.2 | -8.70% | Monday | AMC |
| QTS REALTY TRST | QTS | 0.63 | 0.5 | 8.33% | Monday | AMC |
| CONTAINER STORE | TCS | 0.2 | 0.24 | -180.00% | Monday | AMC |
| AGREE RLTY CORP | ADC | 0.61 | 0.57 | -1.64% | Monday | AMC |
| GULFMARK OFFSHR | GLF | -0.52 | -0.2 | 20.83% | Monday | AMC |
| KNOWLES CORP | KN | -0.04 | 0.04 | 81.25% | Monday | AMC |
| CEB INC | CEB | 0.69 | 0.65 | 7.29% | Monday | AMC |
| CEMENTOS PACASM | CPAC | 0.14 | 0.14 | 13.33% | Monday | AMC |
| CARRIAGE SVCS-A | CSV | 0.45 | 0.42 | -7.14% | Monday | AMC |
| HEARTLAND FINCL | HTLF | 0.63 | 0.76 | 0.00% | Monday | AMC |
| BERKSHIRE HILLS | BHLB | 0.54 | 0.5 | 0.00% | Monday | AMC |
| INDEP BANK GRP | IBTX | 0.63 | 0.6 | 0.00% | Monday | AMC |
| SANMINA CORP | SANM | 0.5 | 0.46 | 5.77% | Monday | AMC |
| BROOKFLD CDA OP | BOXC | 0.29 | 0.33 | -0.90% | Monday | AMC |
| VASCULAR SOLUTN | VASC | 0.23 | 0.21 | 22.22% | Monday | AMC |
| AMER CAP AGENCY | AGNC | 0.56 | 0.7 | -5.26% | Monday | AMC |
| AMER CAMPUS CTY | ACC | 0.62 | 0.67 | 0.00% | Monday | AMC |
| CADENCE DESIGN | CDNS | 0.18 | 0.18 | 25.00% | Monday | AMC |
| AVANGRID INC | AGR | 0.59 | N/A | Monday | AMC | |
| CENTERSTATE BNK | CSFL | 0.25 | 0.2 | 4.55% | Monday | AMC |
| STANLEY FURN CO | STLY | -0.02 | -0.07 | 200.00% | Monday | AMC |
| OCEANEERING INT | OII | 0.34 | 0.7 | 0.00% | Monday | AMC |
| CNX COAL RESRCS | CNXC | 0.2 | N/A | -26.00% | Monday | AMC |
| COMPASS MINERLS | CMP | 1.38 | 1.79 | 24.64% | Monday | AMC |
| GRUPO AEROP-ADS | OMAB | 0.42 | 0.34 | 12.20% | Monday | N/A |
| NIDEC CORP-ADR | NJ | N/A | 0.13 | Monday | N/A | |
| WATERS CORP | WAT | 1.23 | 1.21 | 0.51% | Tuesday | BTO |
| FREEPT MC COP-B | FCX | -0.16 | -0.06 | 85.71% | Tuesday | BTO |
| LILLY ELI & CO | LLY | 0.85 | 0.87 | 1.30% | Tuesday | BTO |
| MASCO | MAS | 0.25 | 0.2 | 11.54% | Tuesday | BTO |
| CORNING INC | GLW | 0.28 | 0.35 | 6.25% | Tuesday | BTO |
| 3M CO | MMM | 1.92 | 1.85 | 11.11% | Tuesday | BTO |
| REYNOLDS AMER | RAI | 0.5 | 0.43 | -4.00% | Tuesday | BTO |
| WHIRLPOOL CORP | WHR | 2.71 | 2.14 | 5.13% | Tuesday | BTO |
| FMC TECH INC | FTI | 0.31 | 0.63 | -8.00% | Tuesday | BTO |
| COACH INC | COH | 0.41 | 0.36 | 4.62% | Tuesday | BTO |
| PENTAIR PLC | PNR | 0.72 | 0.65 | 8.65% | Tuesday | BTO |
| INGERSOLL RAND | IR | 0.37 | 0.38 | 1.08% | Tuesday | BTO |
| PARKER HANNIFIN | PH | 1.45 | 2.06 | 28.81% | Tuesday | BTO |
| PACCAR INC | PCAR | 0.95 | 1.06 | -4.85% | Tuesday | BTO |
| PROCTER & GAMBL | PG | 0.81 | 0.92 | 6.12% | Tuesday | BTO |
| RYDER SYS | R | 1.05 | 1.08 | -5.14% | Tuesday | BTO |
| SIMON PROPERTY | SPG | 2.54 | 2.28 | 11.89% | Tuesday | BTO |
| T ROWE PRICE | TROW | 1.02 | 1.13 | 6.36% | Tuesday | BTO |
| BAXTER INTL | BAX | 0.29 | 1 | 38.71% | Tuesday | BTO |
| CENTENE CORP | CNC | 0.74 | 0.52 | 11.76% | Tuesday | BTO |
| LOCKHEED MARTIN | LMT | 2.51 | 2.74 | 2.73% | Tuesday | BTO |
| DU PONT (EI) DE | DD | 1.02 | 1.34 | 3.85% | Tuesday | BTO |
| HERSHEY CO/THE | HSY | 1.06 | 1.09 | 2.86% | Tuesday | BTO |
| MCGRAW HILL FIN | MHFI | 1.15 | 1.09 | 4.00% | Tuesday | BTO |
| ENTERGY CORP | ETR | 1.23 | 1.68 | 2.60% | Tuesday | BTO |
| FLIR SYSTEMS | FLIR | 0.32 | 0.34 | -2.08% | Tuesday | BTO |
| DTE ENERGY CO | DTE | 1.54 | 1.65 | 4.12% | Tuesday | BTO |
| WYNDHAM WORLDWD | WYN | 1.11 | 1.03 | -1.01% | Tuesday | BTO |
| MARINEMAX INC | HZO | 0.07 | 0.02 | 233.33% | Tuesday | BTO |
| MIMEDX GRP INC | MDXG | 0.05 | 0.04 | 140.00% | Tuesday | BTO |
| AK STEEL HLDG | AKS | -0.15 | -0.28 | 275.00% | Tuesday | BTO |
| POLYONE CORP | POL | 0.48 | 0.46 | -7.14% | Tuesday | BTO |
| THOMSON REUTERS | TRI | 0.44 | 0.44 | 12.07% | Tuesday | BTO |
| B/E AEROSPACE | BEAV | 0.79 | 0.74 | 1.25% | Tuesday | BTO |
| GAMING AND LEIS | GLPI | 0.66 | 0.67 | 6.25% | Tuesday | BTO |
| HUBBELL INC | HUBB | 1.06 | 1.12 | 11.97% | Tuesday | BTO |
| ANIXTER INTL | AXE | 0.81 | 0.81 | -18.52% | Tuesday | BTO |
| SELECT INCOME | SIR | 0.74 | 0.7 | 5.56% | Tuesday | BTO |
| SENSATA TECHNOL | ST | 0.64 | 0.65 | 0.00% | Tuesday | BTO |
| T-MOBILE US INC | TMUS | 0.17 | -0.09 | 183.33% | Tuesday | BTO |
| TENNECO INC | TEN | 1.11 | 0.88 | 21.93% | Tuesday | BTO |
| CONSOL ENERGY | CNX | -0.09 | 0.37 | -120.00% | Tuesday | BTO |
| ASBURY AUTO GRP | ABG | 1.33 | 1.3 | -4.38% | Tuesday | BTO |
| BLOOMIN BRANDS | BLMN | 0.5 | 0.54 | 3.45% | Tuesday | BTO |
| JETBLUE AIRWAYS | JBLU | 0.53 | 0.4 | 9.80% | Tuesday | BTO |
| SPIRIT AIRLINES | SAVE | 0.97 | 0.96 | 4.08% | Tuesday | BTO |
| TECK RESOURCES | TCK | -0.06 | 0.09 | 200.00% | Tuesday | BTO |
| ALLY FINANCIAL | ALLY | 0.55 | 0.52 | 1.96% | Tuesday | BTO |
| ASTEC INDS INC | ASTE | 0.73 | 0.65 | -55.56% | Tuesday | BTO |
| JANUS CAP GRP | JNS | 0.2 | 0.23 | 4.17% | Tuesday | BTO |
| PENSKE AUTO GRP | PAG | 0.87 | 0.85 | 0.00% | Tuesday | BTO |
| WADDELL&REED -A | WDR | 0.55 | 0.8 | 0.00% | Tuesday | BTO |
| G&K SVCS A | GK | 0.89 | 0.81 | 3.37% | Tuesday | BTO |
| SONIC AUTOMOTVE | SAH | 0.4 | 0.37 | 3.39% | Tuesday | BTO |
| ALLIANCE RES | ARLP | 0.41 | 0.92 | -10.13% | Tuesday | BTO |
| CAPELLA EDUCATN | CPLA | 0.81 | 0.8 | 1.05% | Tuesday | BTO |
| CYNOSURE INC-A | CYNO | 0.14 | 0.15 | 16.67% | Tuesday | BTO |
| ENTEGRIS INC | ENTG | 0.15 | 0.18 | 25.00% | Tuesday | BTO |
| FELCOR LODGING | FCH | 0.14 | 0.14 | -6.25% | Tuesday | BTO |
| 1800FLOWERS.COM | FLWS | -0.14 | 0.01 | 4.55% | Tuesday | BTO |
| GRAPHIC PKG HLD | GPK | 0.18 | 0.17 | 11.76% | Tuesday | BTO |
| NAVIGANT CONSLT | NCI | 0.22 | 0.23 | 40.00% | Tuesday | BTO |
| POTLATCH CORP | PCH | -0.01 | 0.14 | 50.00% | Tuesday | BTO |
| SUPERVALU INC | SVU | 0.17 | 0.24 | 0.00% | Tuesday | BTO |
| BP PLC | BP | -0.26 | 0.85 | -57.14% | Tuesday | BTO |
| COMP TASK | CTG | 0.04 | 0.08 | 45.45% | Tuesday | BTO |
| FIRSTMERIT CORP | FMER | 0.33 | 0.33 | -2.94% | Tuesday | BTO |
| CNOVA NV | CNV | -0.06 | -0.06 | -3500.00% | Tuesday | BTO |
| CARPENTER TECH | CRS | 0.3 | 0.32 | 0.00% | Tuesday | BTO |
| FLAGSTAR BANCP | FBC | 0.42 | 0.43 | 2.33% | Tuesday | BTO |
| FIAT CHRYSLER | FCAU | 0.21 | 0.06 | 0.00% | Tuesday | BTO |
| STEPAN CO | SCL | 1.02 | 0.9 | 39.62% | Tuesday | BTO |
| TWIN DISC | TWIN | -0.16 | 0.26 | -12.50% | Tuesday | BTO |
| ALLEGIANCE BCSH | ABTX | 0.33 | N/A | -5.71% | Tuesday | BTO |
| ALLIANCE HLDGS | AHGP | 0.82 | 1.09 | -15.79% | Tuesday | BTO |
| AIXTRON AG-ADR | AIXG | -0.06 | -0.09 | 0.00% | Tuesday | BTO |
| AVX CORP | AVX | 0.17 | 0.2 | 0.00% | Tuesday | BTO |
| II-VI INCORP | IIVI | 0.27 | 0.24 | 10.71% | Tuesday | BTO |
| PROVIDENT FINL | PROV | 0.15 | 0.29 | -60.71% | Tuesday | BTO |
| WABTECH | WAB | 1 | 0.99 | 0.00% | Tuesday | BTO |
| OFFICE DEPOT | ODP | 0.13 | 0.13 | -36.36% | Tuesday | BTO |
| EXTENDED STAY | STAY | 0.12 | 0.15 | 7.14% | Tuesday | BTO |
| DEL FRISCOS RST | DFRG | 0.21 | 0.23 | 0.00% | Tuesday | BTO |
| ALLEGHENY TECH | ATI | -0.59 | 0.09 | -43.59% | Tuesday | BTO |
| FIRST COMW FINL | FCF | 0.15 | 0.16 | -12.50% | Tuesday | BTO |
| HEIDRICK & STRG | HSII | 0.2 | 0.18 | -65.00% | Tuesday | BTO |
| NORD ANGLIA EDU | NORD | 0.27 | 0.25 | -3.85% | Tuesday | BTO |
| SUN CMNTYS INC | SUI | 0.88 | 0.9 | -4.71% | Tuesday | BTO |
| BAYER A G -ADR | BAYRY | 2.48 | 2.33 | -10.00% | Tuesday | BTO |
| PEOPL BNCP-OHIO | PEBO | 0.38 | 0.43 | -12.50% | Tuesday | BTO |
| THOMSON REUT-TS | T.TRI | 0.6 | 0.53 | 11.54% | Tuesday | BTO |
| CANON INC ADR | CAJ | 0.33 | 0.26 | -5.45% | Tuesday | BTO |
| ACTIVE POWER | ACPW | -0.15 | -0.07 | -160.00% | Tuesday | BTO |
| EDWARDS LIFESCI | EW | 0.66 | 0.56 | 6.78% | Tuesday | AMC |
| REALTY INCOME | O | 0.71 | 0.68 | 2.90% | Tuesday | AMC |
| AFLAC INC | AFL | 1.62 | 1.54 | 5.41% | Tuesday | AMC |
| PUBLIC STORAGE | PSA | 2.2 | 1.91 | 1.24% | Tuesday | AMC |
| TOTAL SYS SVC | TSS | 0.57 | 0.51 | -3.64% | Tuesday | AMC |
| EBAY INC | EBAY | 0.39 | 0.67 | 6.98% | Tuesday | AMC |
| CH ROBINSON WWD | CHRW | 0.81 | 0.73 | 1.15% | Tuesday | AMC |
| AT&T INC | T | 0.69 | 0.63 | -1.56% | Tuesday | AMC |
| APPLE INC | AAPL | 1.97 | 2.33 | 1.23% | Tuesday | AMC |
| CAPITAL ONE FIN | COF | 1.9 | 1.97 | 3.73% | Tuesday | AMC |
| BOSTON PPTYS | BXP | 1.59 | 1.3 | 0.79% | Tuesday | AMC |
| TORCHMARK CORP | TMK | 1.07 | 1.04 | -0.94% | Tuesday | AMC |
| ASSURANT INC | AIZ | 1.3 | 0.63 | -37.01% | Tuesday | AMC |
| ROBT HALF INTL | RHI | 0.64 | 0.58 | 1.43% | Tuesday | AMC |
| AKAMAI TECH | AKAM | 0.51 | 0.5 | 7.84% | Tuesday | AMC |
| FIRSTENERGY CP | FE | 0.77 | 0.62 | 0.00% | Tuesday | AMC |
| KLA-TENCOR CORP | KLAC | 1 | 0.84 | 20.93% | Tuesday | AMC |
| CINCINNATI FINL | CINF | 0.77 | 0.59 | 20.88% | Tuesday | AMC |
| EQUITY RESIDENT | EQR | 0.76 | 0.79 | 0.00% | Tuesday | AMC |
| CHIPOTLE MEXICN | CMG | -1.06 | 3.88 | 17.30% | Tuesday | AMC |
| NUVASIVE INC | NUVA | 0.27 | 0.3 | 16.67% | Tuesday | AMC |
| BOYD GAMING CP | BYD | 0.25 | 0.13 | 14.29% | Tuesday | AMC |
| NCR CORP-NEW | NCR | 0.33 | 0.43 | 5.75% | Tuesday | AMC |
| BARRACUDA NTWRK | CUDA | -0.01 | -0.03 | 300.00% | Tuesday | AMC |
| JOHN BEAN TECH | JBT | 0.3 | 0.27 | 14.75% | Tuesday | AMC |
| CALAMOS ASSET-A | CLMS | 0.03 | 0.17 | 63.64% | Tuesday | AMC |
| PANERA BREAD CO | PNRA | 1.5 | 1.41 | 5.62% | Tuesday | AMC |
| MUELLER WATER | MWA | 0.1 | 0.08 | 33.33% | Tuesday | AMC |
| COVANTA HOLDING | CVA | -0.09 | -0.13 | -78.57% | Tuesday | AMC |
| RESMED INC | RMD | 0.69 | 0.65 | 4.55% | Tuesday | AMC |
| TANGER FACT OUT | SKT | 0.56 | 0.5 | 1.75% | Tuesday | AMC |
| MERCURY SYSTEMS | MRCY | 0.14 | 0.18 | 16.67% | Tuesday | AMC |
| VANTIV INC-A | VNTV | 0.5 | 0.41 | 3.33% | Tuesday | AMC |
| EXACTECH INC | EXAC | 0.3 | 0.29 | 3.57% | Tuesday | AMC |
| PS BUSINESS PKS | PSB | 1.25 | 1.13 | 6.50% | Tuesday | AMC |
| BUFFALO WLD WNG | BWLD | 1.77 | 1.52 | -10.20% | Tuesday | AMC |
| HIGHWOODS PPTYS | HIW | 0.78 | 0.72 | 1.23% | Tuesday | AMC |
| HUB GROUP INC-A | HUBG | 0.4 | 0.32 | 12.50% | Tuesday | AMC |
| UTD STATES STL | X | -1.29 | -0.07 | 72.94% | Tuesday | AMC |
| ULTIMATE SOFTWR | ULTI | 0.19 | 0.15 | 3.33% | Tuesday | AMC |
| BRIXMOR PPTY GP | BRX | 0.51 | 0.49 | 0.00% | Tuesday | AMC |
| TWITTER INC | TWTR | -0.13 | -0.2 | 46.15% | Tuesday | AMC |
| WABASH NATIONAL | WNC | 0.24 | 0.19 | 24.39% | Tuesday | AMC |
| BARRICK GOLD CP | ABX | 0.1 | 0.05 | 14.29% | Tuesday | AMC |
| HEALTHSOUTH CP | HLS | 0.55 | 0.44 | 0.00% | Tuesday | AMC |
| RENAISSANCERE | RNR | 2.81 | 3.1 | 9.25% | Tuesday | AMC |