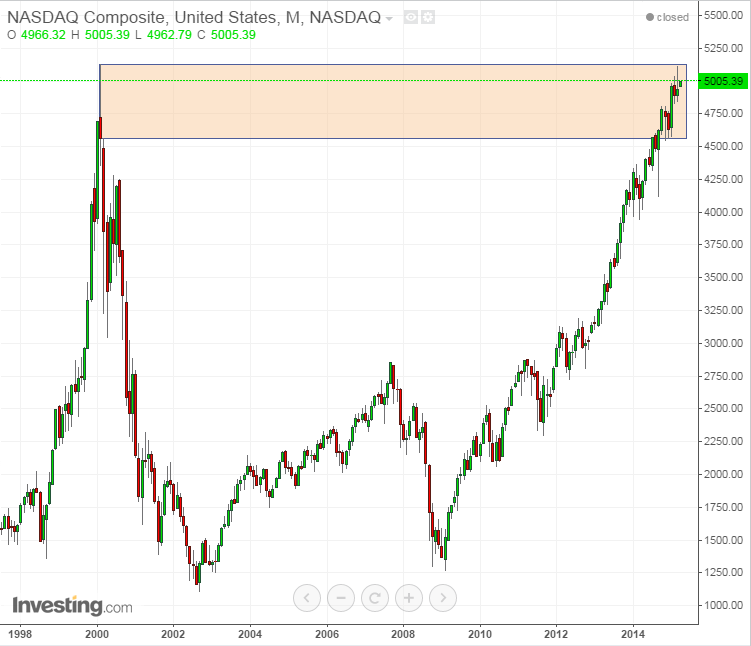
Look at the monthly charts of the major indices and you’ll see a similarity in the monthly and weekly candles; The monthly candles show sellers’ pressure, while the weekly candles keep compressing. Still, the monthly trend remains very bullish, while the indices keep breaking all-time highs. This means there are no supply zones above, in other words, no existing historical precedent indicating sellers' interest (except for the NASDAQ Composite, which has almost consumed the last supply zone of 2000).
If you’re a long-term investor, there’s still no reason to get out of the markets, as long as no clear reversal signs or hints of weakness have been observed. Unless an unexpected market crash of some sort occurs, the markets generally show signs – fundamental and technical – before a trend reversal.
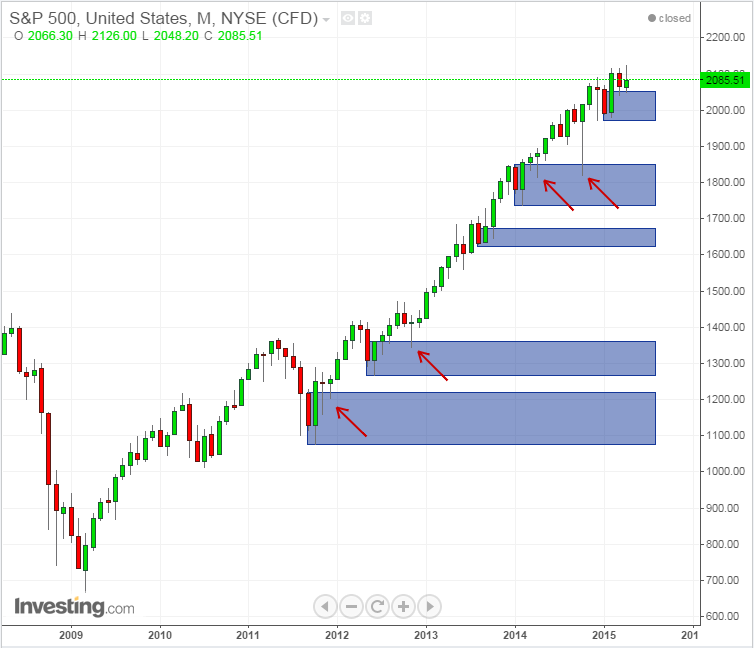
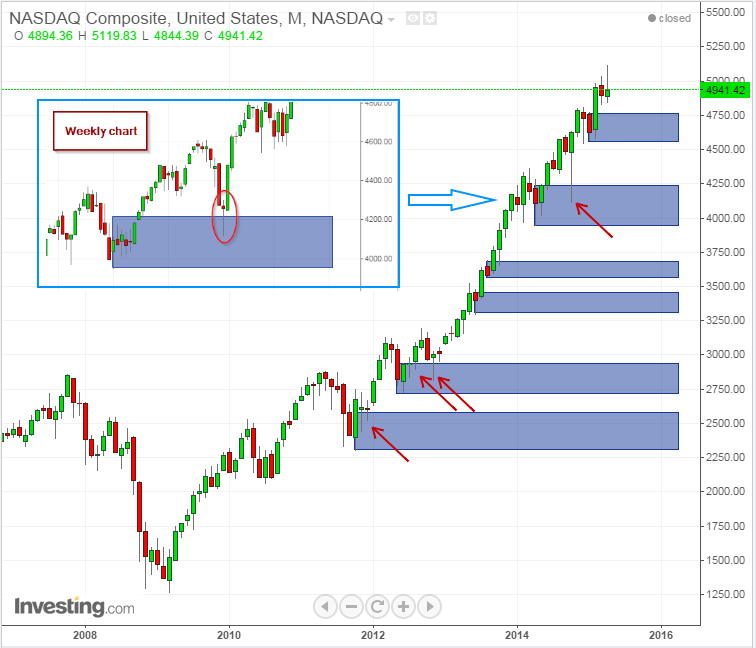
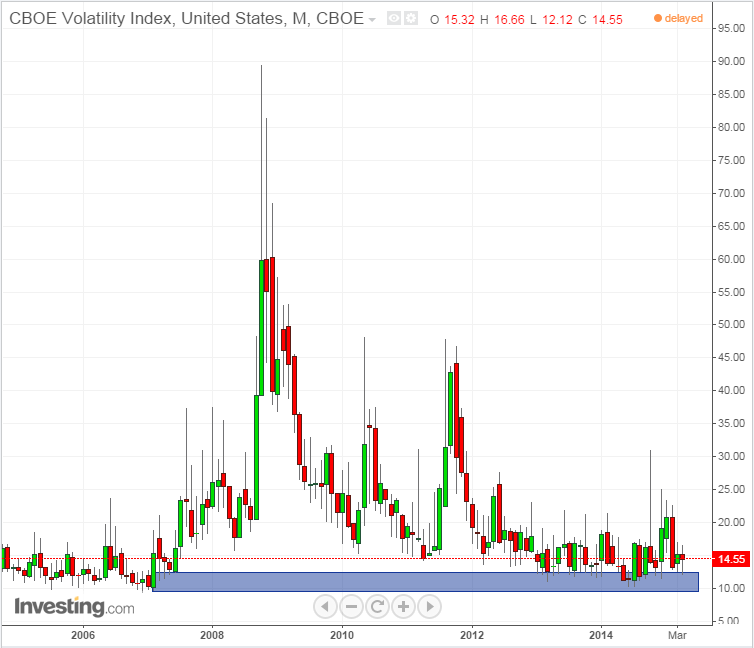
Currently, the S&P 500, the Dow 30, the NASDAQ Composite and the FTSE 100 are sitting above fresh monthly demand zones (blue rectangles), while the DAX and Nikkei hover well above. The Volatility Index (VIX) is still lingering at the bottom, just above a relentless monthly demand zone.
Here are a few monthly charts which show strong monthly demand zones. Which ones do you think will see more upside?
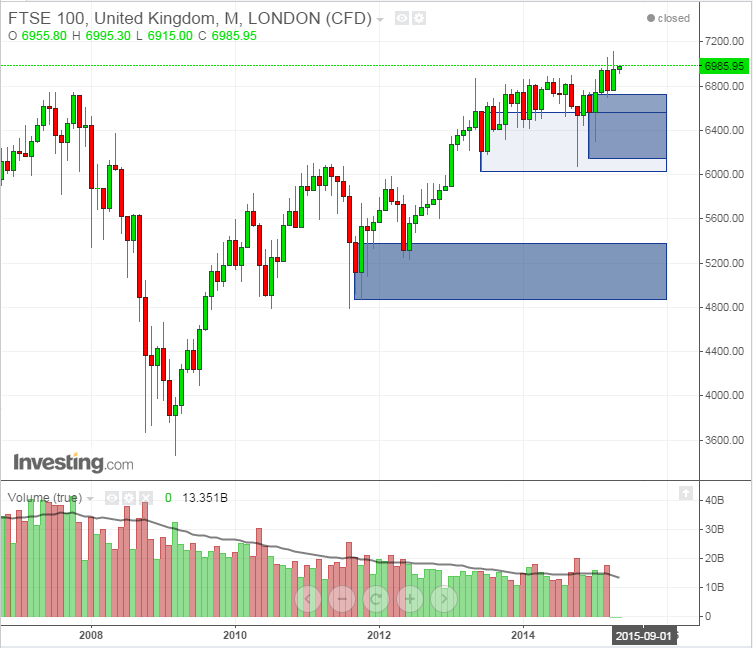
Notice the ongoing divergence between the FTSE 100's uptrend and its volume's downtrend; the monthly candles are all sitting very tightly on the monthly supply zones, lacking any conviction in their uptrend. Unless we see some more convincing moves up, there is a greater chance of a drop through the current demand zone.
The NASDAQ Composite has not yet closed above its all-time high, and as can be seen in the second chart below, it is very close to the top of the monthly supply zone. April's monthly candle is showing sellers' pressure, so buyers should be much more cautious. Buying - if any - of the index's futures contracts, ETFs or technology stocks should be done close to demand zones, not in "mid-air".
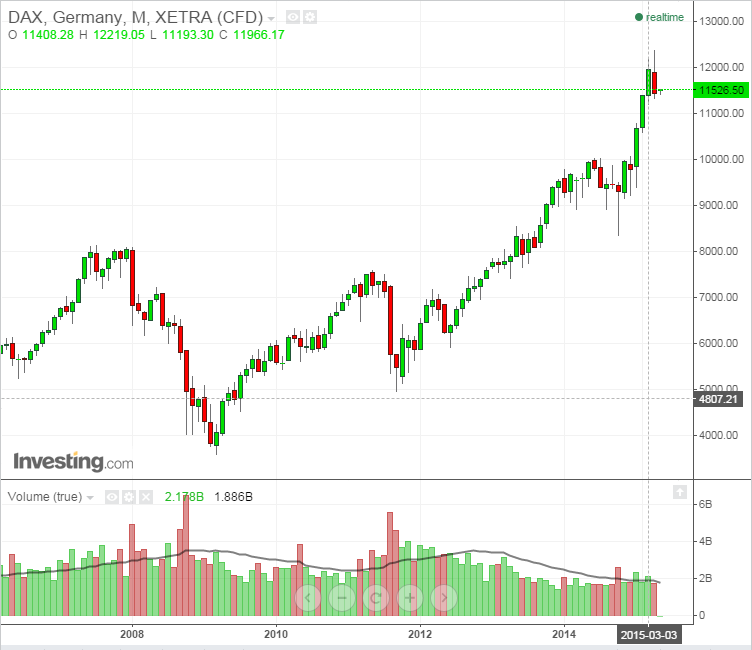
The DAX closed last month with a big bearish candle that wiped out most of its predecessor's gains. It is lingering well-above the monthly demand zone. The trend is still very bullish, and the stochastic and MACD indicators are not showing any weakness in the form of a potential bearish divergence.
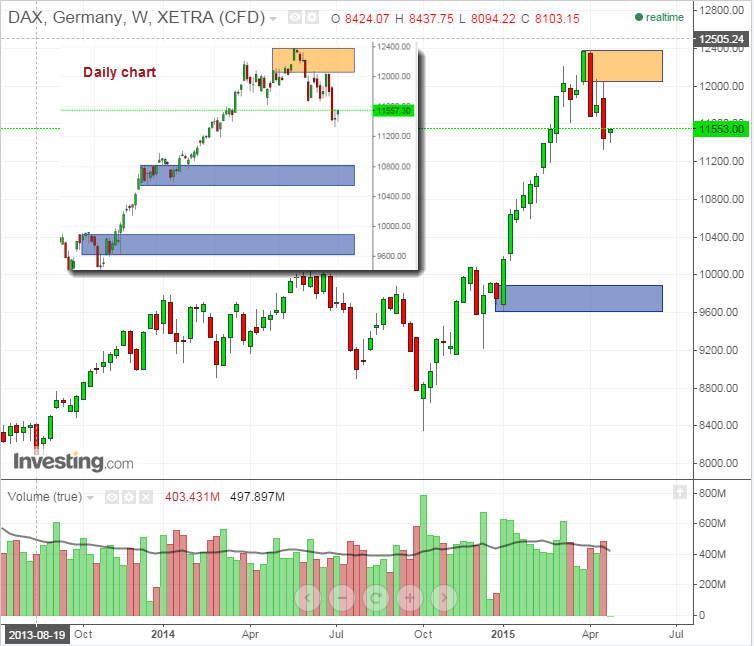
That being said, on the weekly chart a fresh supply zone has been created with a strong bearish engulfing candle, which gives the supply zone additional validity. A retracement towards the zone, followed by bearish price action, will give the cue for more losses ahead. The closest weekly demand zone resides around 9900, with a daily demand zone around 10815.
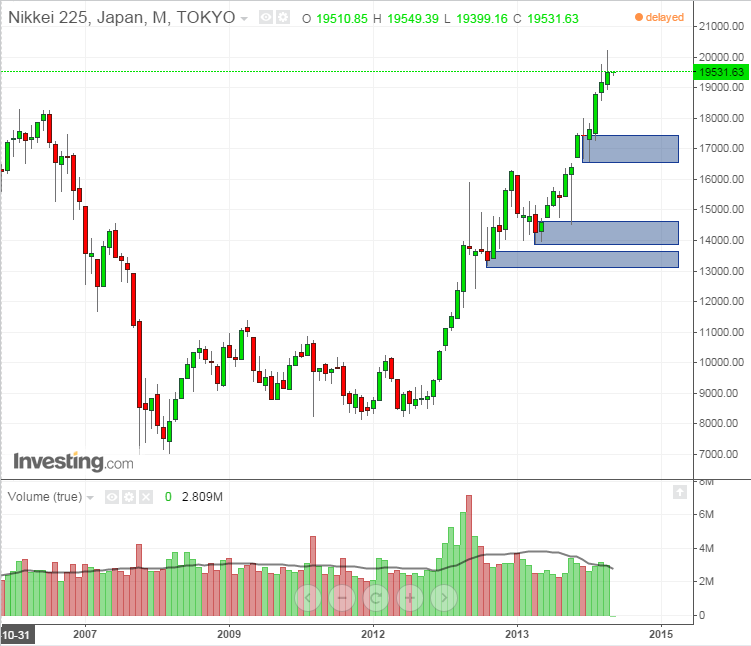
The Nikkei 225 monthly candles are showing pressure from sellers as well. Buying near demand zones is always safer and gives better risk:reward ratios.
Disclaimer: The information provided represents the author's own opinions and does not contain a recommendation for any particular security or investment. The author, as well as Investing.com editors who helped produce this article, may own positions in instruments mentioned. We encourage you to do your own due diligence.
