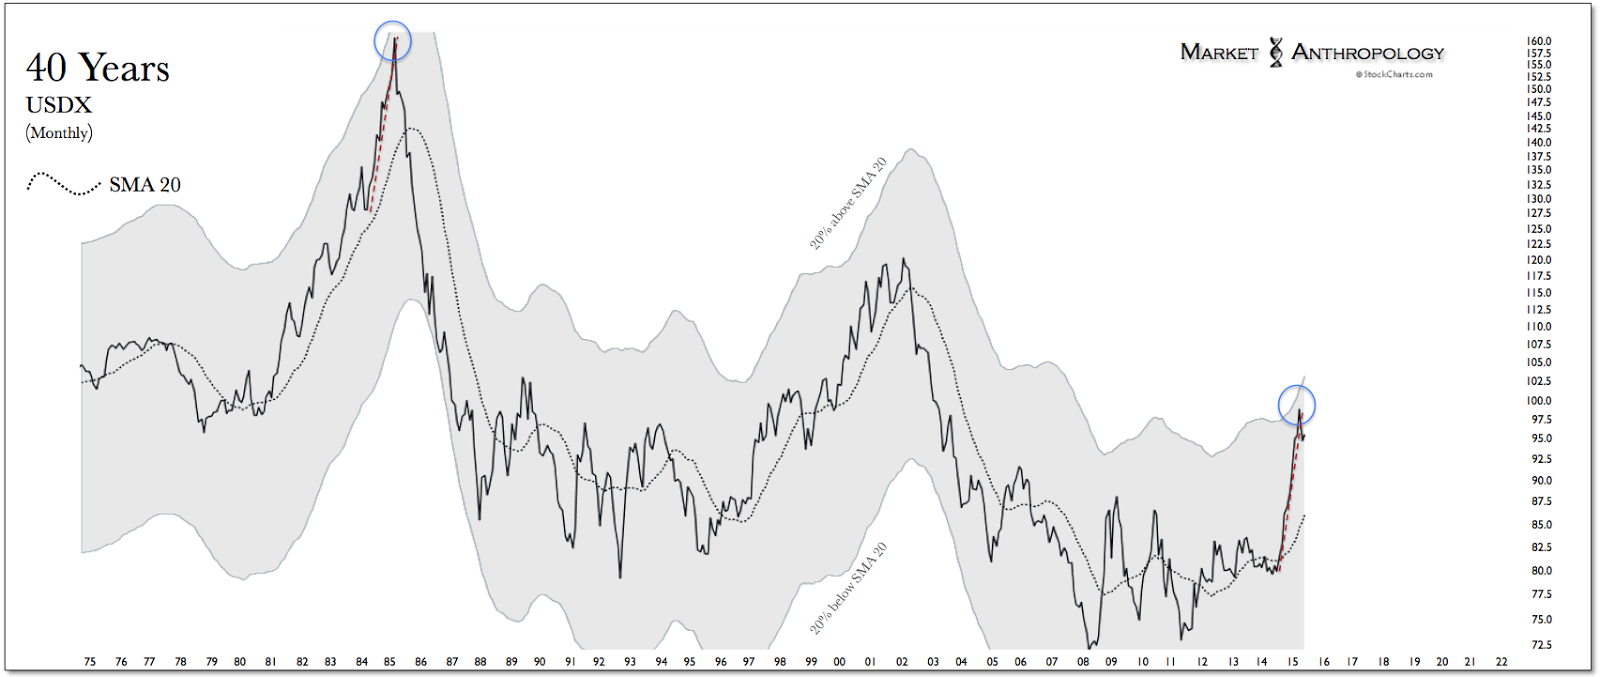
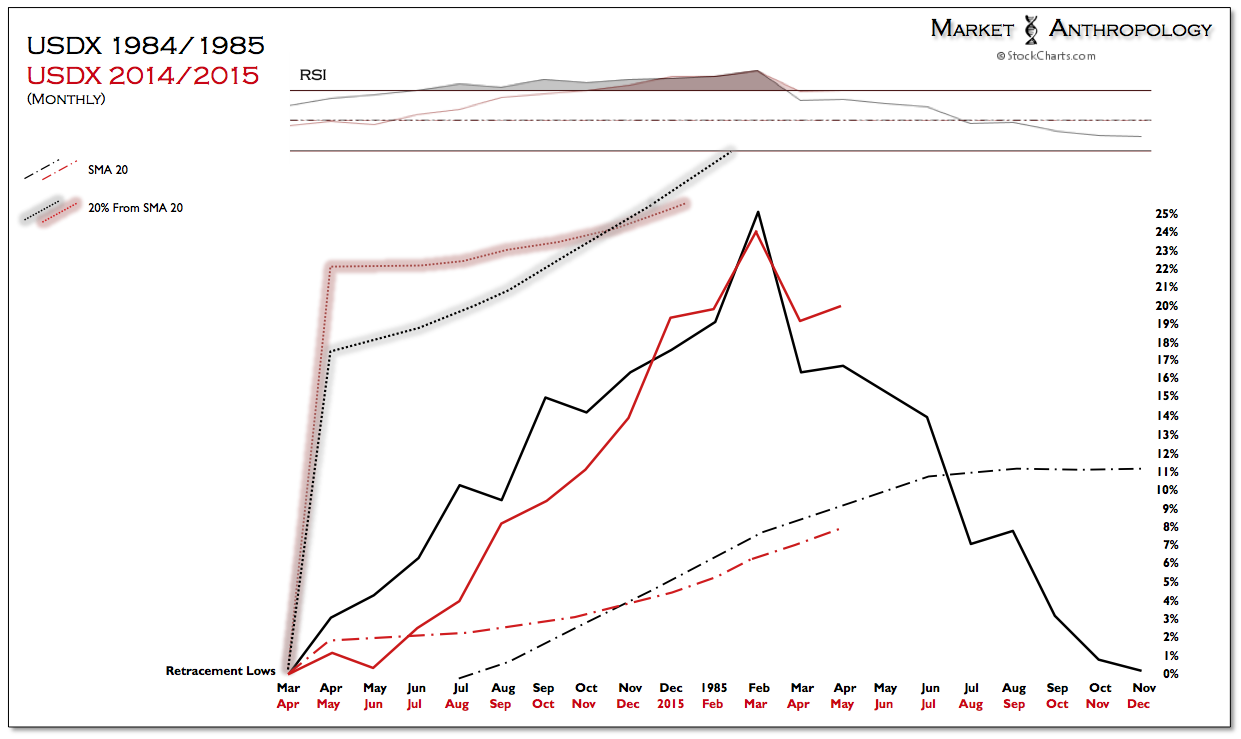
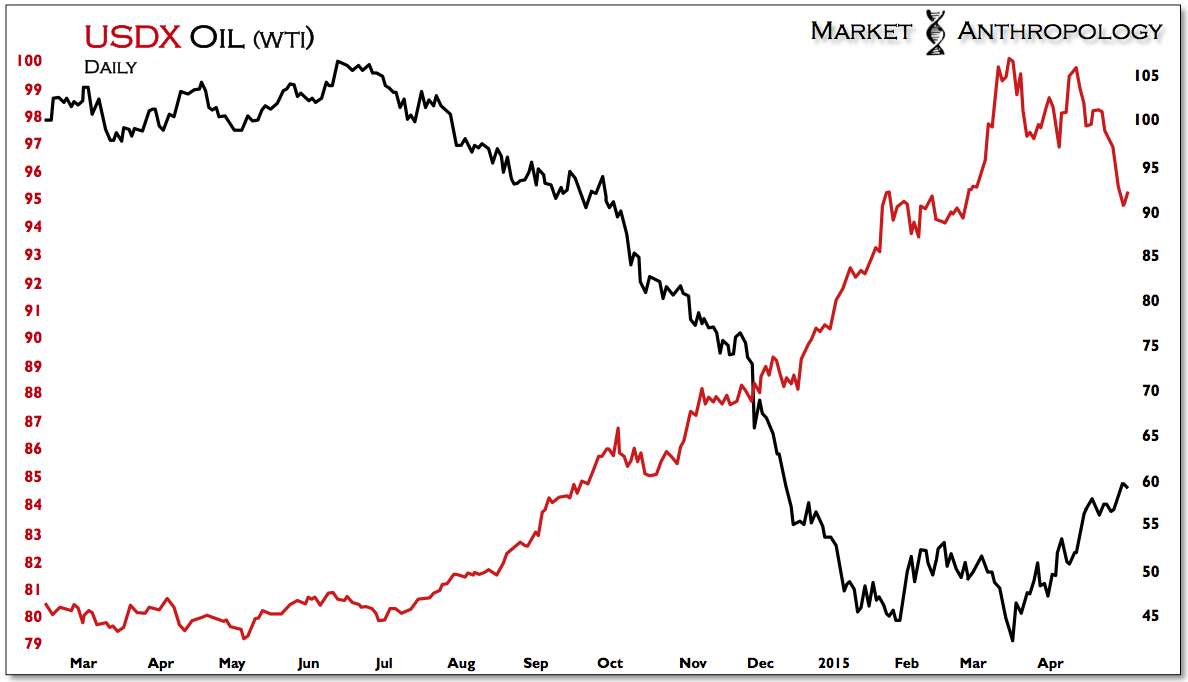
The U.S. dollar index pulled back sharply last month from the relative performance extreme notched in March. Declining ~5 percent from the intra-month high on April 13th, the index gained considerable downside momentum in the backside of the month - following the performance pivot of arguably the last time it was stretched to a comparable performance extreme, three decades before in 1985.
Through last Thursday's close, the index recorded six consecutive daily losses and closed the month below long-term trend line resistance and its 50 percent retracement high - which also marked the cyclical top in July 2001 from the index's secular peak in 1985.
To put it mildly, the dollar hollered last month - just not as most participants suspected.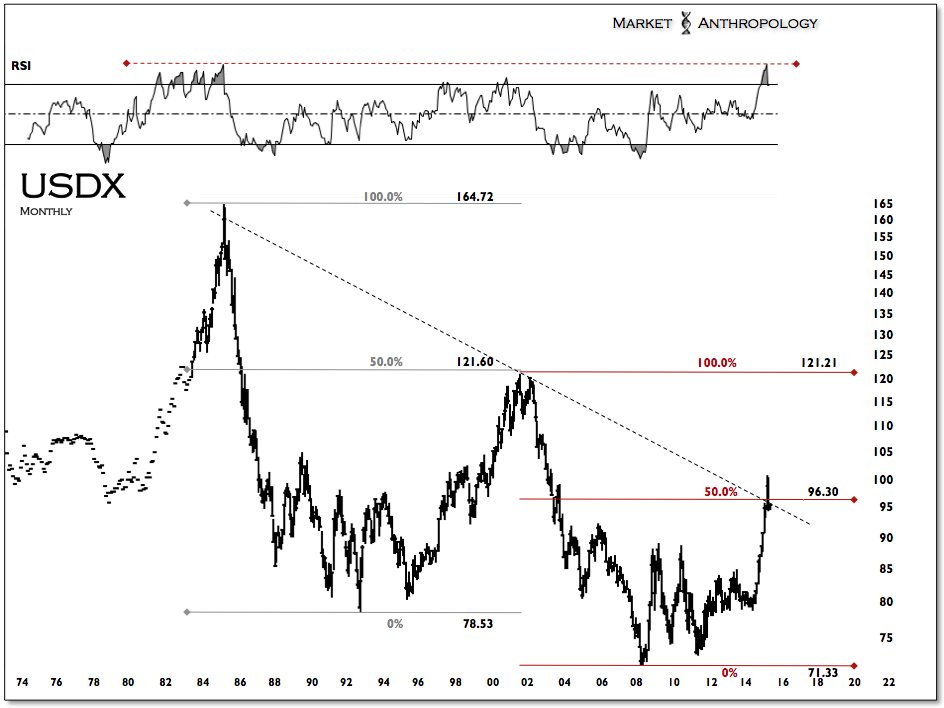
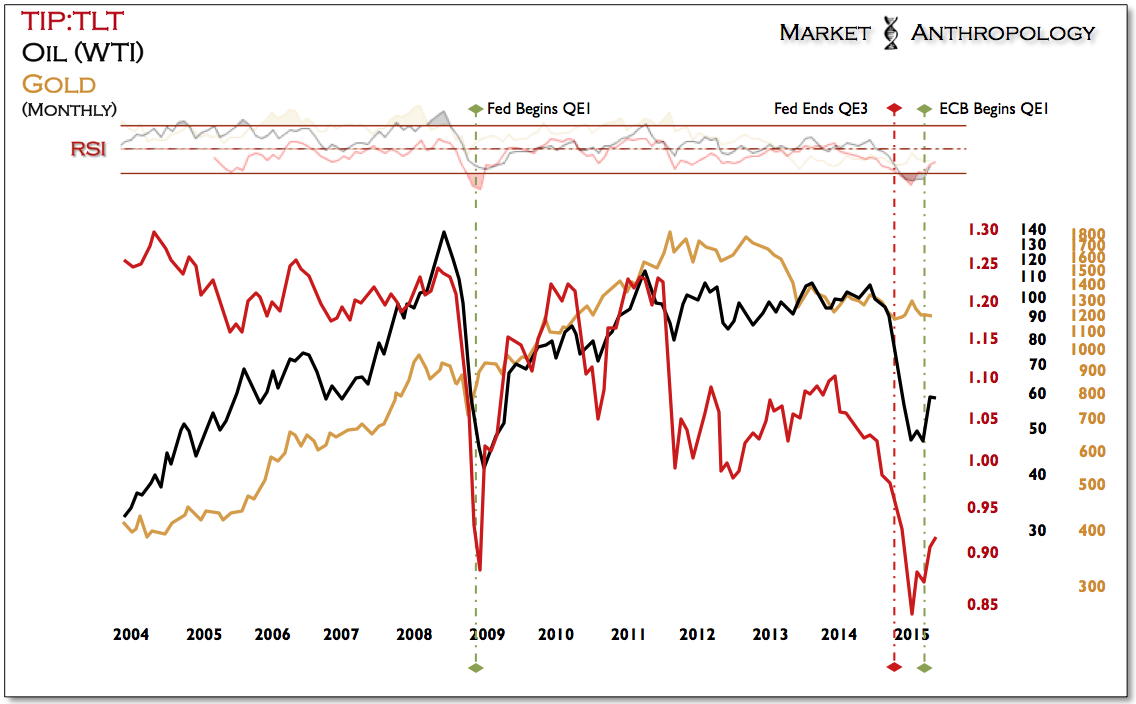
Our expectations remain that the U.S. dollar is poised for a significant retracement of the move that began last spring, which should buttress a reflationary tailwind in commodities and a stiffening headwind in the government bond market; most recently on display last week with the biggest selloff since 2011 in Germany's 10-Year bunds. With the large reversal, the market all but erased its gains since the ECB began buying debt on March 9th - and climbed out of the basement with a close 1 basis point higher than Japan's 10-Year yield.
It would appear that the market is well on it's way back to establishing a new long-term equilibrium, after following Dornbush's overshooting model to levels significantly below most participants expectations. 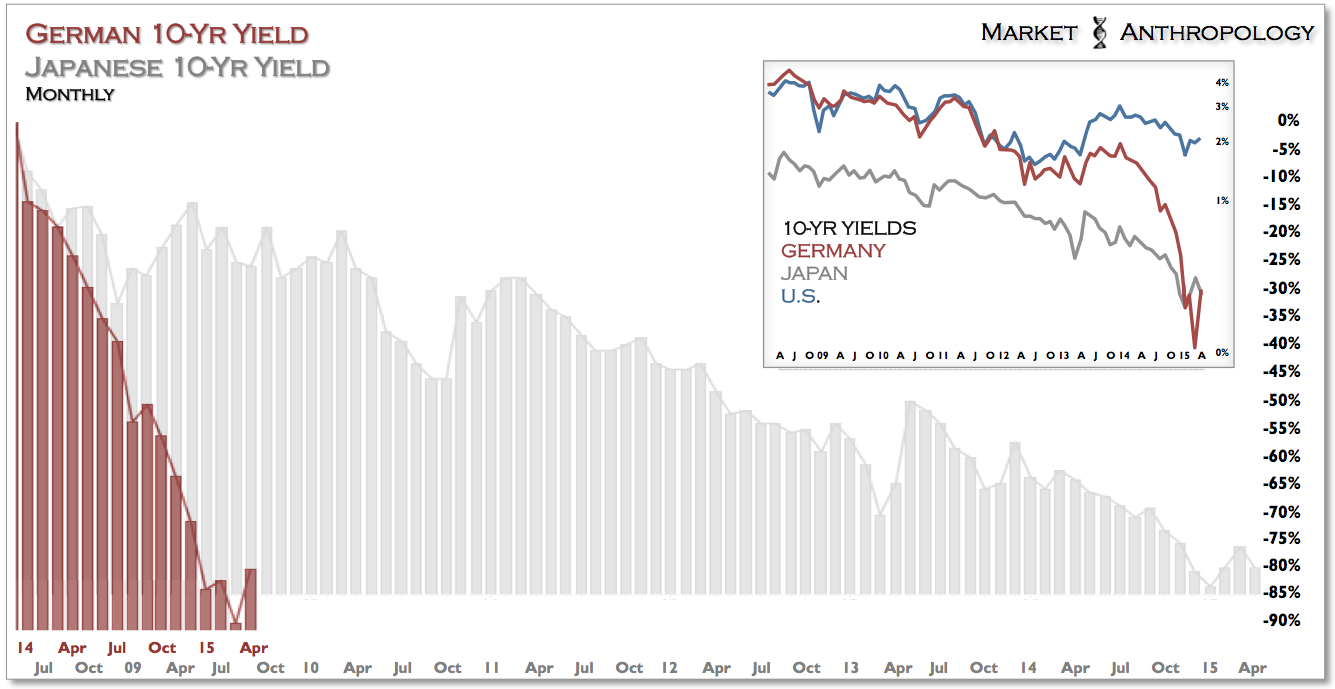
Although many participants believe that the actions by the ECB will continue to suppress yields and support the market; as described in previous notes, if the program successfully gains traction, we would expect yields to remain supported as inflation expectations improve.
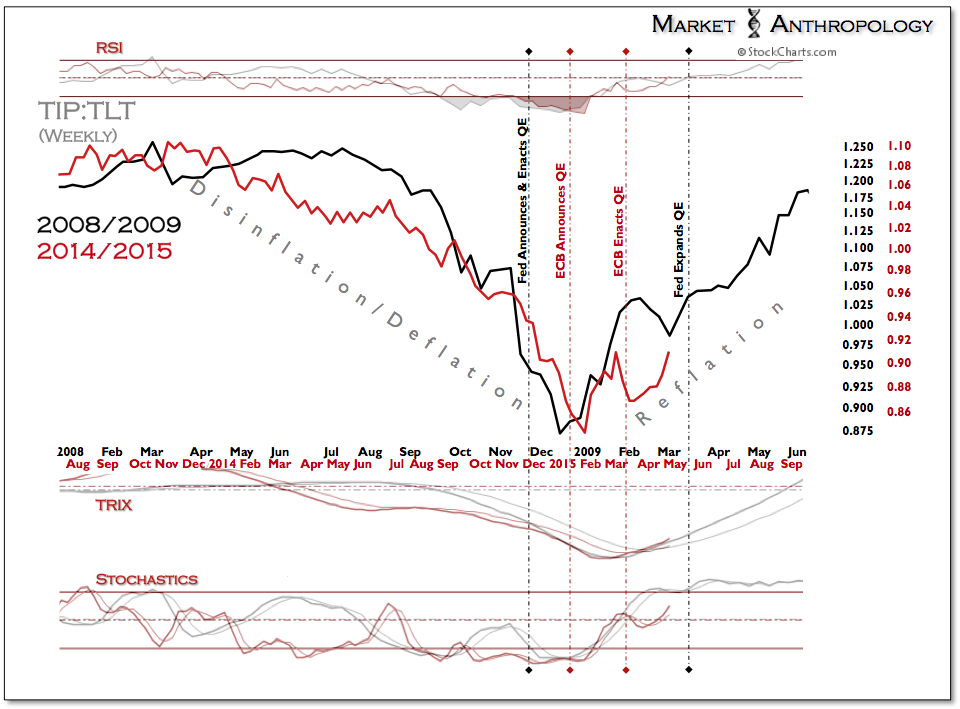
This perspective would support an overweight position in inflation protected securities relative to nominal Treasuries and a constructive market environment for hard commodities - such as copper, oil and precious metals. 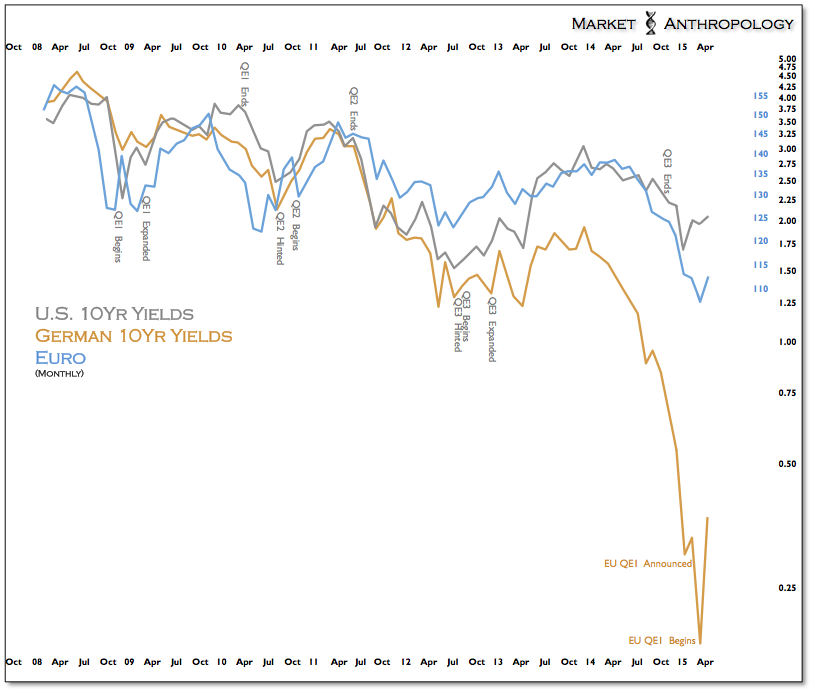
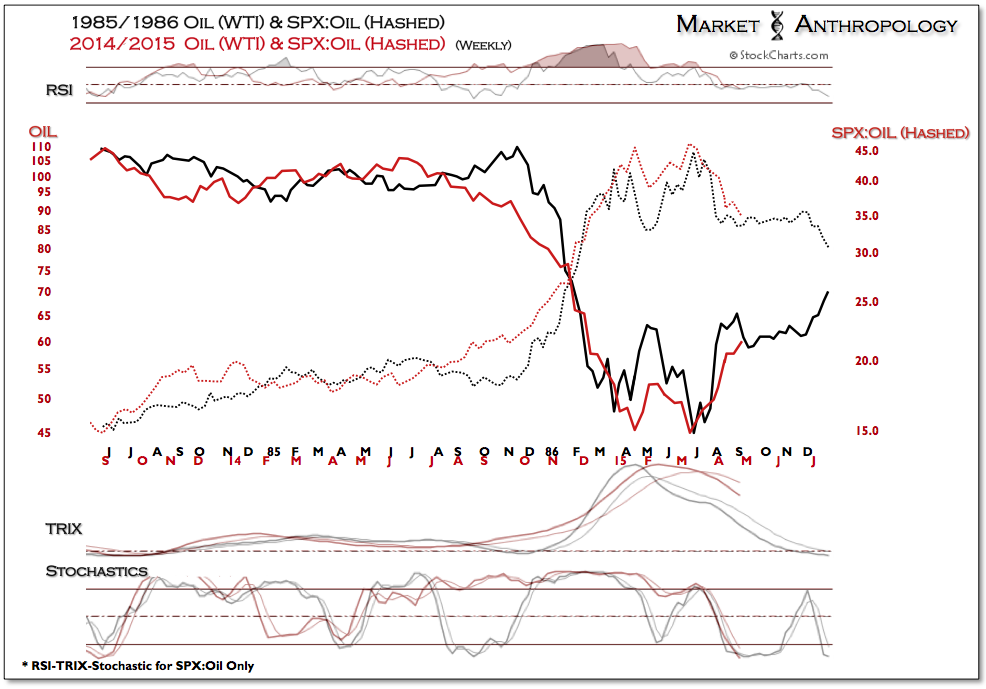
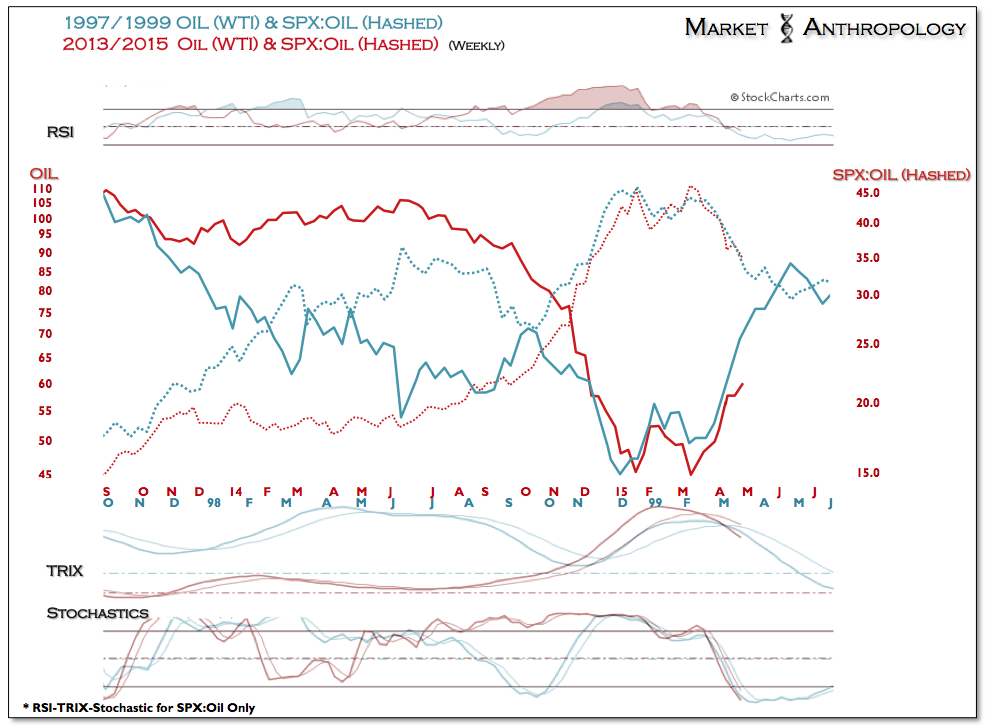
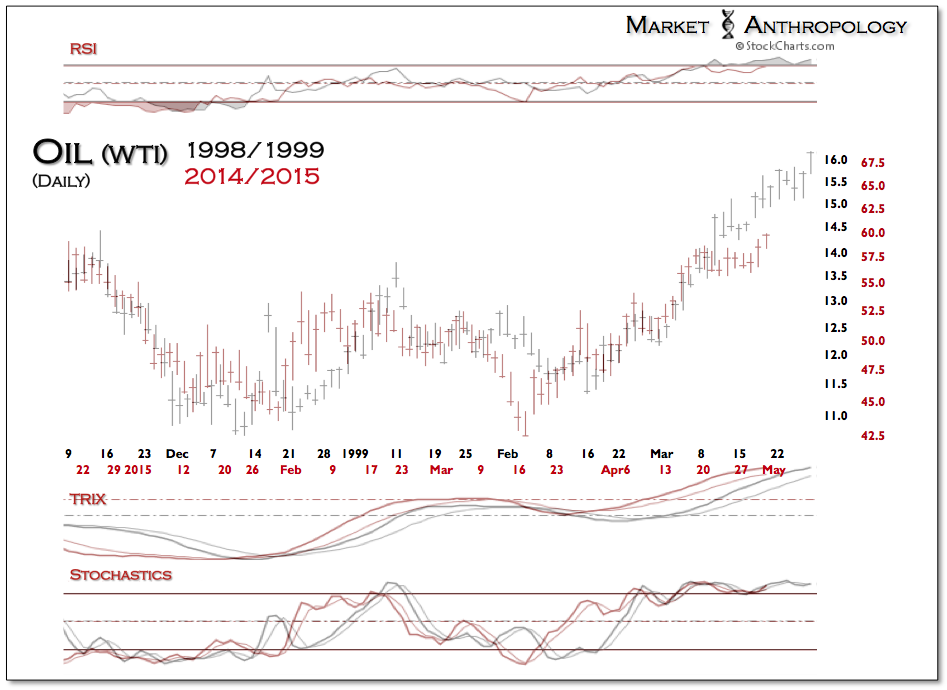
The SPX:Oil ratio continues to display the hallmarks of a major blowoff move and downside reversal, last witnessed in the two previous pivots (1986 and 1999) that make up the asymmetrical disinflationary/reflationary construct that the ratio represents. While the 1999 pivot exhibited a more long-term reversal in relative outperformance between asset classes; subsequent to the reversal, both market environments saw oil outperform equities over the next year.
That said, considering how momentum in the reversal is unfurling and our thoughts on the U.S. dollar, we are more inclined to speculate oil will trade closer to the 1998/1999 analog than the 1985/1986 reversal. 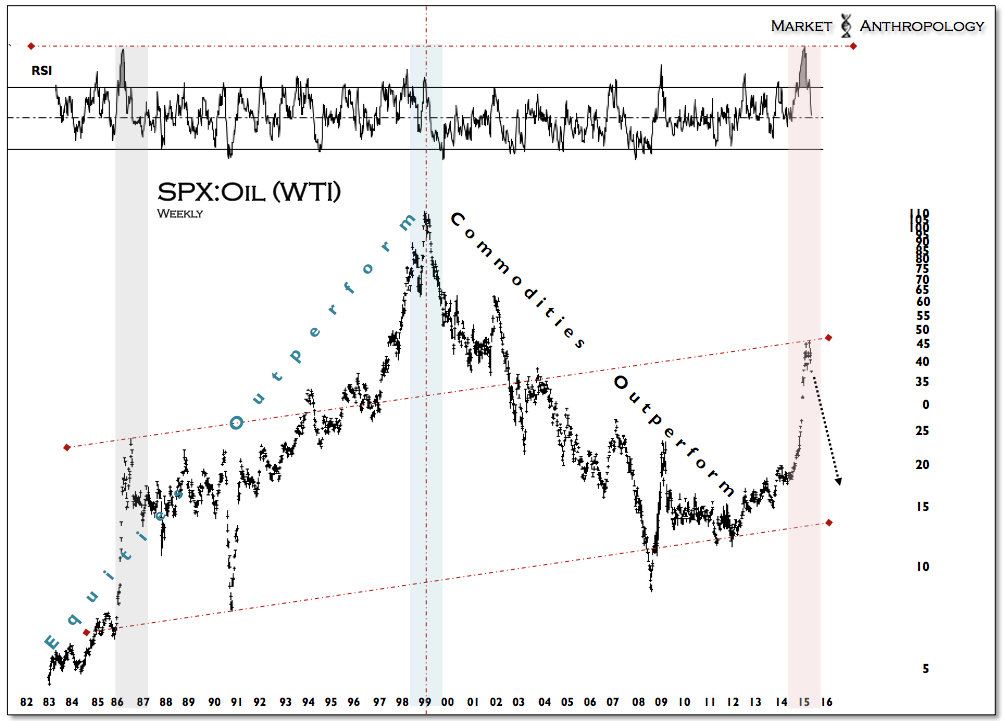
The question remains how the U.S equity markets will adjust to rising inflation expectations, which we have speculated in the past could provide the spark for a cyclical move lower in stocks and the catalyst for another rising tide in commodities. This market environment would be similar to what transpired in the previous trough of the long-term yield cycle after the secular peak in equities in 1929. Both in 1937 - and again in 1946, the equity market rally exhausted as the Fed pivoted away from extraordinary monetary accomodation. 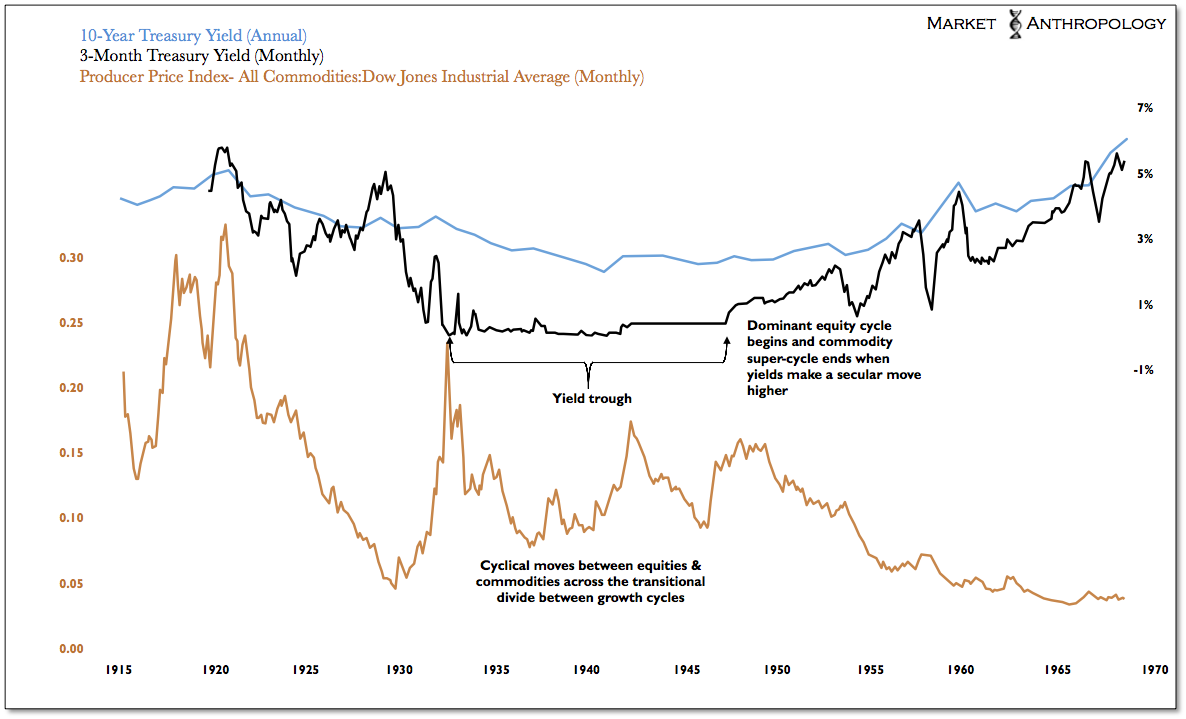
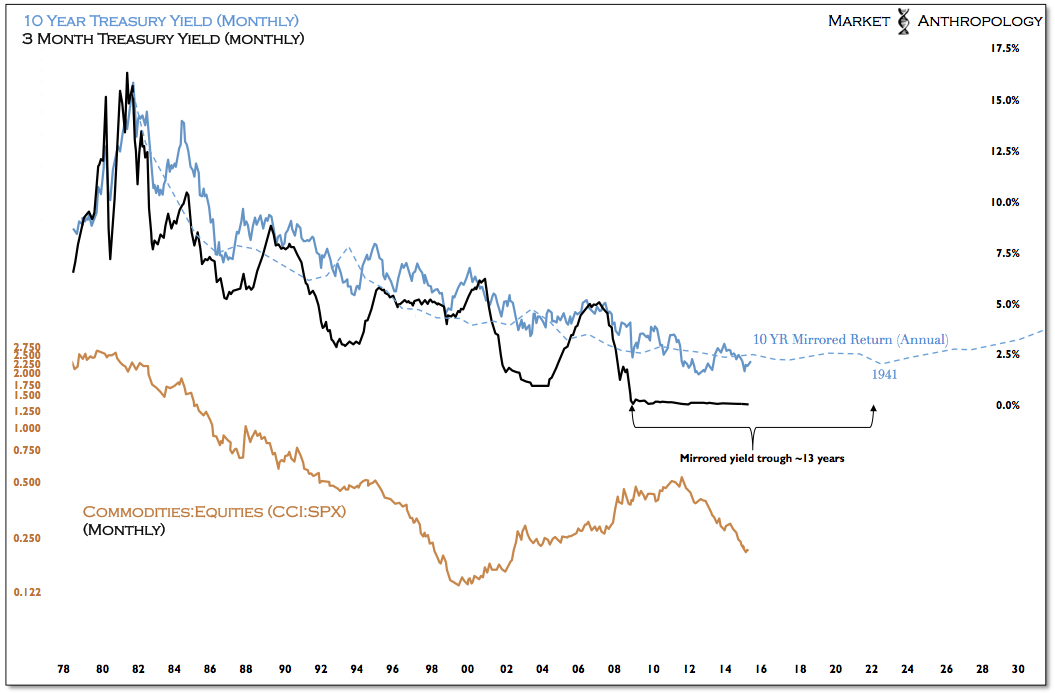
It's interesting to note that from a comparative perspective with the previous long-term yield cycle and the violent fall into the trough, the market is currently situated where the Fed moved to tighten policy through 1936 and 1937 after economic and market conditions improved following the crash in 1929.
While we know the lessons from that time period loom large in policy markers deliberations, we still consider the closest parallels to be from the mid 1940's when the Fed ended their extraordinary support of the Treasury market and moved to normalize policy. In either example, the course of Fed policy became increasingly difficult for participants to navigate as improving economic conditions muddled future market expectations, eventually destabilizing the broadly benevolent market conditions for equities.
This is why we have found the parallels with more recent Fed tightening regimes so misplaced, as policy conditions, tools and market psychologies are vastly different today than where they stood in previous cycles. 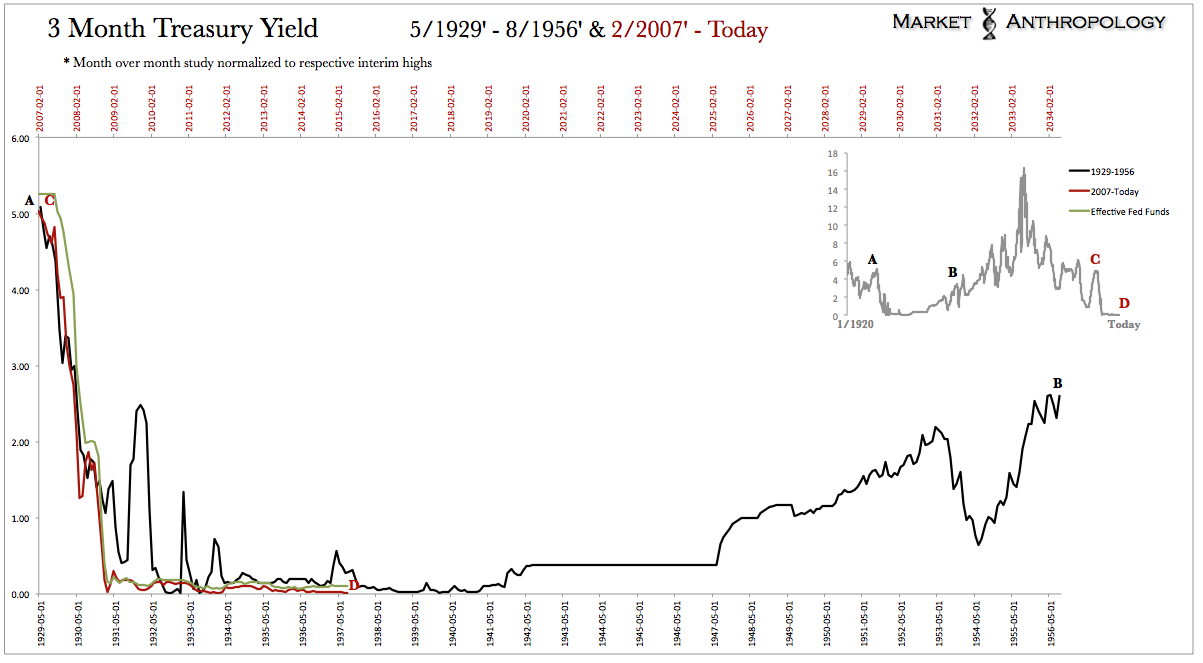
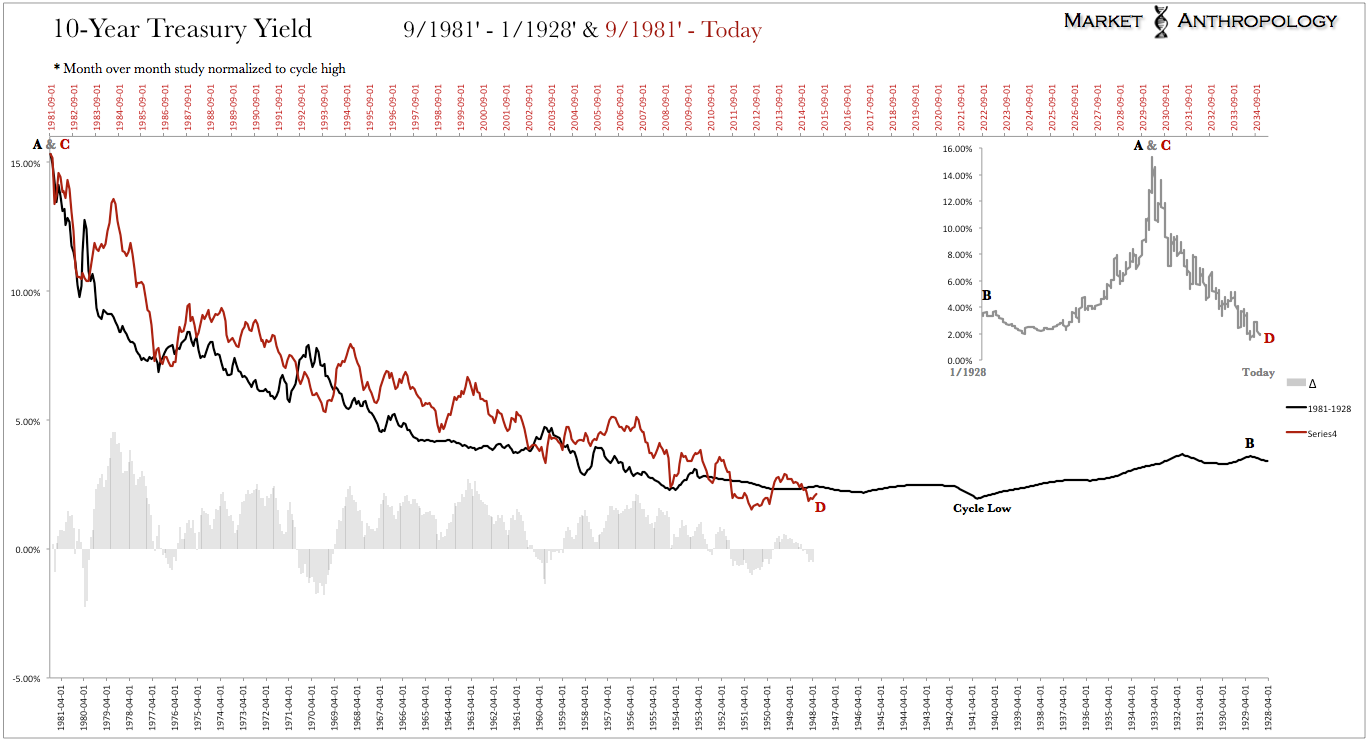
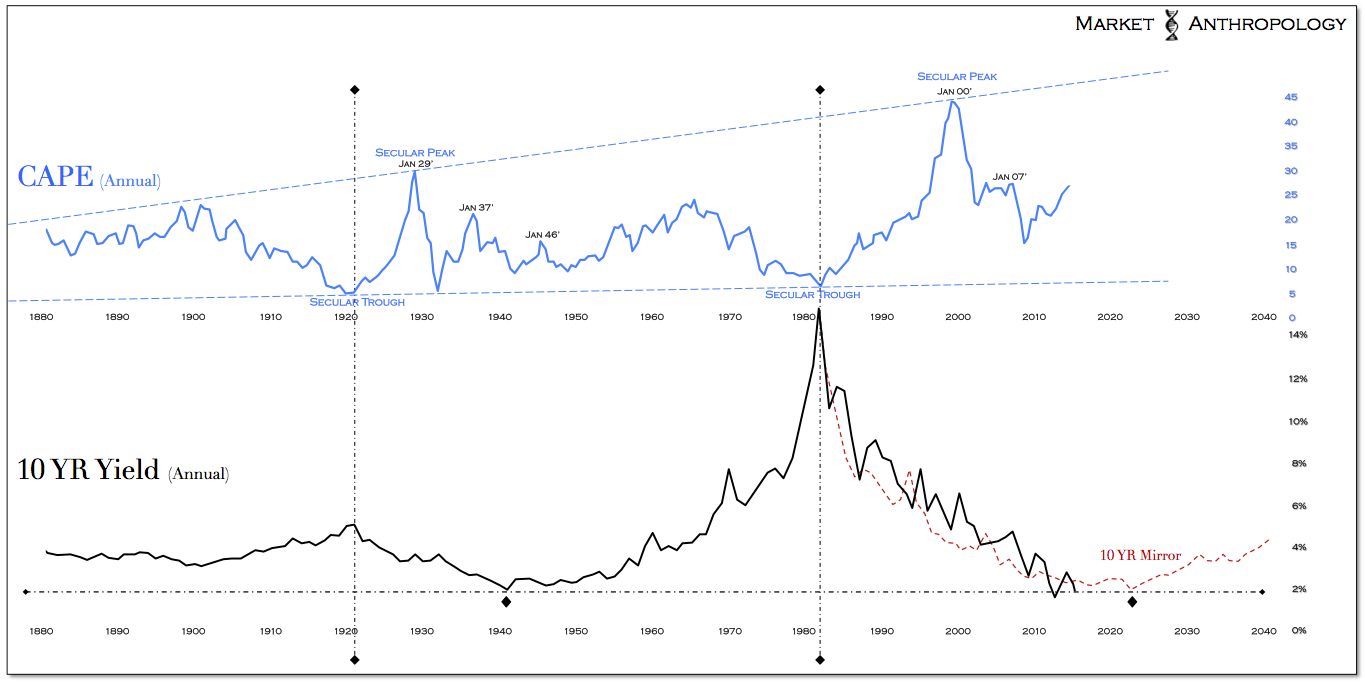
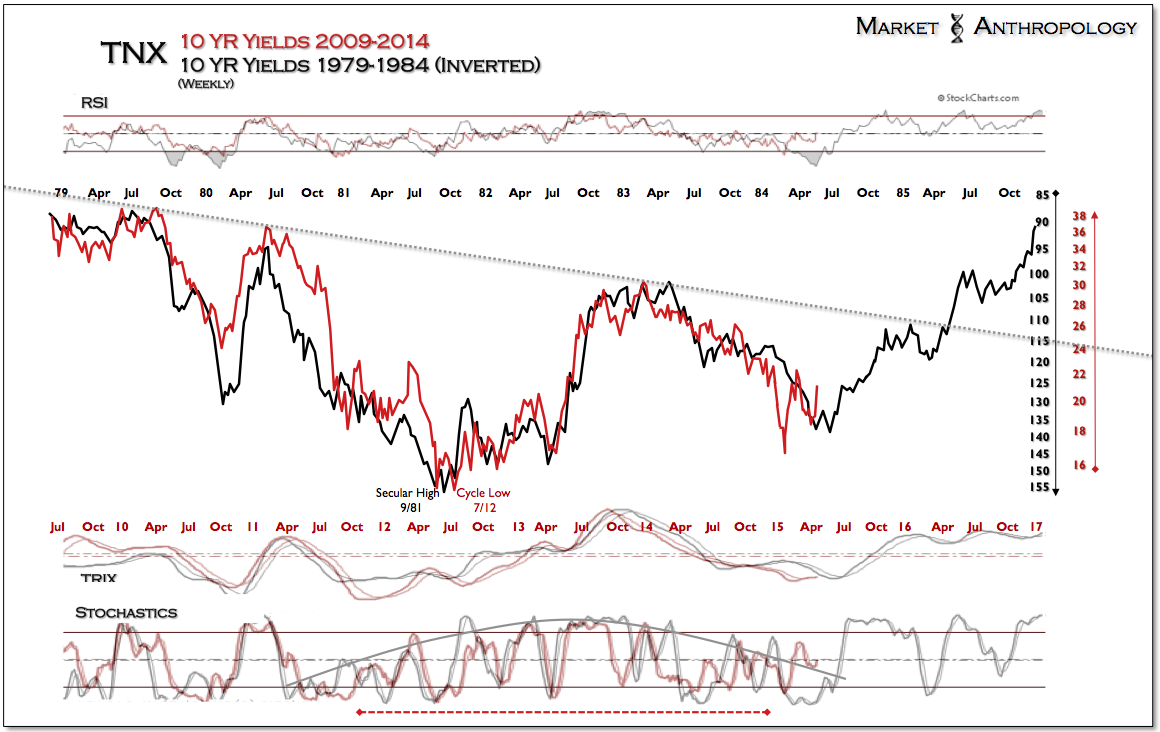
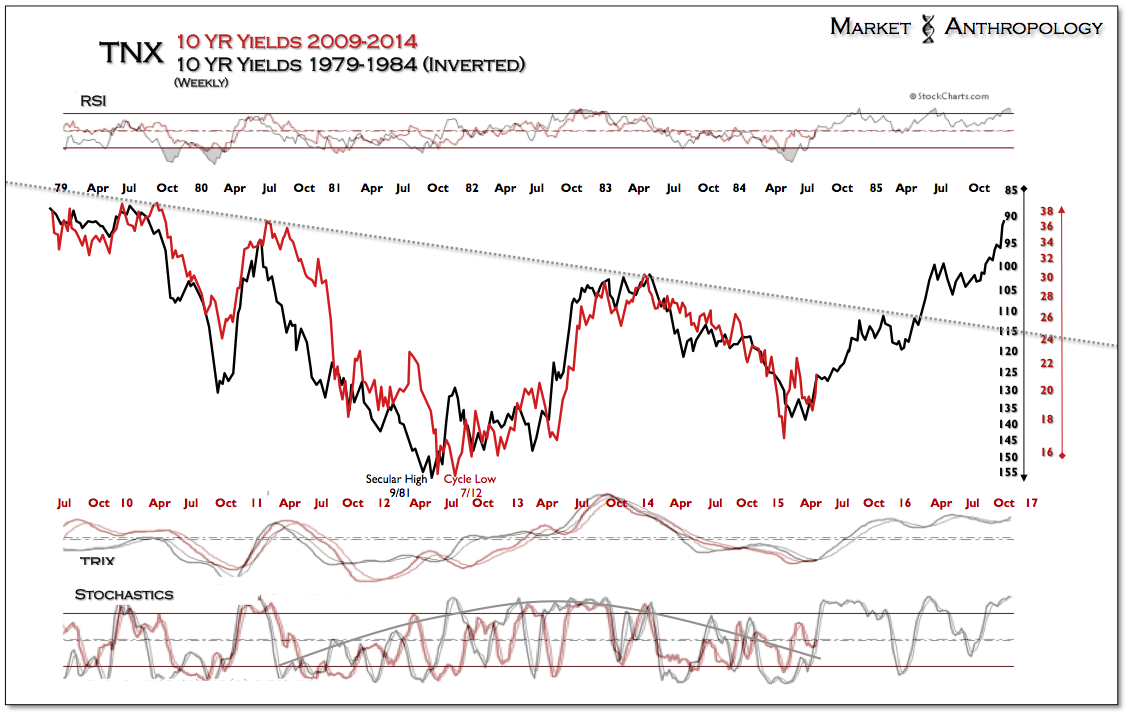
As a post script, we included an update of the 1979-1985 inverse secular pivot of 10-year yields (TNX), which we have followed with fascination over the past year and which pointed last winter towards the retracement level realized in yields in the first quarter.
We shifted the series to "tare-up" with the secondary low (high in the inverse) of the pattern, which would place yields on a glide path higher over the coming months. This perspective is supported by our analogs and retracement mirrors with the long-term yield cycle, which currently places the 10-year below its historic bearing ~ 2.40 percent.
While we don't expect yields to sustain a prolonged move higher, the patterned momentum congruences continue to replicate on the inverse of the cycle. From our perspective, 10-year yields have ~ 50 basis points of room to move higher up to longer-term overhead resistance. 