
M&T Bank Corporation’s (NYSE:MTB) net operating earnings of $2.13 per share for third-quarter 2016 handily beat the Zacks Consensus Estimate $2.04. Also, the bottom line improved 9% year over year.
Results were aided by revenue growth, partially offset by higher expenses. The company witnessed continued growth in loan and deposit balances and maintained a strong capital position.
Net operating income came in at $356 million, up 25% year over year.
On a GAAP basis, M&T Bank’s earnings per share of $2.10 also increased 9% year over year. Net income climbed 25% year over year to $350 million.
NII & Fee Income Growth Boost Revenues, Expenses Rise
M&T Bank’s revenues came in at $1.35 billion, outpacing the Zacks Consensus Estimate of $1.32 billion. Also, it compared favorably with the year-ago figure of $1.13 billion.
Taxable-equivalent net interest income increased 24% year over year to $865 million in the quarter, driven by increased average earning assets. However, net interest margin declined 9 basis points year over year to 3.05%.
Driven by solid growth in mortgage banking revenues and rise in trading account and foreign exchange gains, the company’s other income climbed 12% year over year to $491 million.
Non-interest expenses were $752 million, up 15% from the prior-year quarter. Excluding certain non-operating items, non-interest operating expenses came in at $743 million, increasing 14% from the prior-year quarter. The rise reflected the impact of operations obtained in the Hudson City acquisition. The quarter reflected an increase in several cost heads, including salaries and employee benefits and net occupancy expense, and FDIC assessments
Efficiency ratio declined to 55.9% in quarter from 57.1% in the prior-year quarter. Generally, a lower ratio indicates improved efficiency.
Loans and leases, net of unearned discount, increased 31% year over year to $88.67 billion at the end of the quarter. Moreover, total deposits rose 35% year over year to $98.14 billion.
M&T Bank's net operating income reflected an annualized rate of return on average tangible assets and average tangible common shareholder equity of 1.18% and 12.77%, respectively, compared with 1.88% and 12.98% recorded in the prior-year quarter.
Mixed Credit Quality
M&T Bank reflected a mixed credit quality in the reported quarter. Provision for credit losses increased 7% year over year to $47 million. Net charge-offs of loans came in at $41 million, slightly up 14% year over year. Further, non-performing assets increased 17% year over year to $997 million.
However, the ratio of non-accrual loans to total net loans was 0.93%, down from 1.15% in the prior-year quarter. Also, allowance for credit losses to total loans was 1.09%, down from 1.36% prior-year quarter.
Strong Capital Position
M&T Bank’s estimated Common Equity Tier 1 to risk-weighted assets under regulatory capital rules was around 10.76%. Tangible equity per share came in at $67.42, up 10% year over year.
Share Repurchase
During the third quarter, M&T Bank repurchased 3,039,563 shares of common stock for a total cost of $350 million.
Our Viewpoint
M&T Bank’s results reflect a decent performance in the quarter. We believe that the company, with its solid business model and strategic acquisitions, is well poised for growth. The Hudson City acquisition has, in all probability, provided an upside to M&T Bank’s top line by leveraging on the former’s retail network as well as product and balance-sheet diversification.
However, regulatory issues and margin pressure amid a persistent low interest rate environment remain headwinds for M&T Bank.
M&T BANK CORP Price, Consensus and EPS Surprise
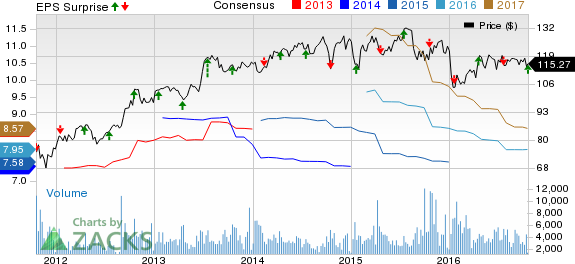
M&T BANK CORP Price, Consensus and EPS Surprise | M&T BANK CORP Quote
M&T Bank currently carries a Zacks Rank #3 (Hold). You can see the complete list of today’s Zacks #1 (Strong Buy) Rank stocks here.
Performance of Other Major Bank
Among major banks, JPMorgan Chase & Co.’s (NYSE:JPM) third-quarter 2016 earnings of $1.58 per share handily surpassed the Zacks Consensus Estimate of $1.40. However, the figure reflects a 6% decline from the year-ago period. Notably, the results included a legal benefit of $71 million.
Driven by a strong top-line growth, Wells Fargo & Company’s (NYSE:WFC) third-quarter 2016 earnings recorded a positive surprise of about 1%. Earnings of $1.03 per share beat the Zacks Consensus Estimate by a penny. However, it compared unfavorably with the prior-year quarter’s earnings of $1.05 per share.
Driven by a decline in operating expenses, Citigroup Inc. (NYSE:C) delivered a positive earnings surprise of nearly 8% in third-quarter 2016. The company’s earnings from continuing operations per share of $1.25 for the quarter outpaced the Zacks Consensus Estimate of $1.16. However, earnings compared unfavorably with the year-ago figure of $1.36 per share.
Confidential from Zacks
Beyond this Analyst Blog, would you like to see Zacks' best recommendations that are not available to the public? Our Executive VP, Steve Reitmeister, knows when key trades are about to be triggered and which of our experts has the hottest hand. Click to see them now>>
JPMORGAN CHASE (JPM): Free Stock Analysis Report
M&T BANK CORP (MTB): Free Stock Analysis Report
WELLS FARGO-NEW (WFC): Free Stock Analysis Report
CITIGROUP INC (C): Free Stock Analysis Report
Original post
Zacks Investment Research