Get 40% Off
🚨 Volatile Markets? Find Hidden Gems for Serious OutperformanceFind Stocks Now

Lufthansa Ready To Take Off Again?

Published 04/05/2015, 01:31 AM
Updated 07/09/2023, 06:31 AM

Deutsche Lufthansa AG (XETRA:LHAG, OTC:DLAKY) stock lost almost three euro per share since the 15.50 top it reached in the end of January 2015. We will get a rather negative outlook, if we examine only the last couple of months.

Fortunately, charts give us the opportunity to look at earlier price action. In Lufthansa’s case, it is interesting to see how prices have been moving since October 2014.
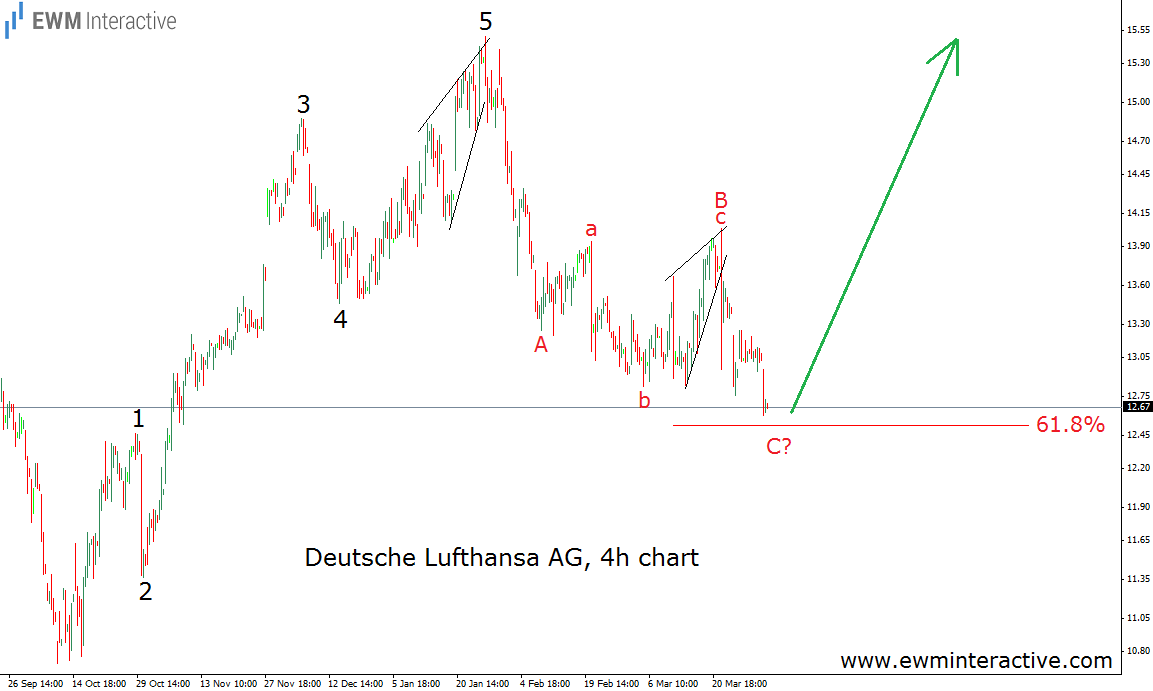
Lufthansa 4-H Chart
As visible, there is a very clear five-wave sequence between October 2014 and January 2015. Naturally, just as the Elliott Wave Principle postulates, it is followed by a three-wave correction in the opposite direction. According to the theory, Lufthansa stock should resume the uptrend, once the retracement is over.

As the chart shows, the price is approaching the 61.8% Fibonacci level. It is the area, where corrections often terminate, so we would love to see a bullish reversal there. Even if we do not, the count remains valid as long as the invalidation level at 10.67 is untouched.

Original post

Latest comments

Risk Disclosure: Trading in financial instruments and/or cryptocurrencies involves high risks including the risk of losing some, or all, of your investment amount, and may not be suitable for all investors. Prices of cryptocurrencies are extremely volatile and may be affected by external factors such as financial, regulatory or political events. Trading on margin increases the financial risks.
Before deciding to trade in financial instrument or cryptocurrencies you should be fully informed of the risks and costs associated with trading the financial markets, carefully consider your investment objectives, level of experience, and risk appetite, and seek professional advice where needed.
Fusion Media would like to remind you that the data contained in this website is not necessarily real-time nor accurate. The data and prices on the website are not necessarily provided by any market or exchange, but may be provided by market makers, and so prices may not be accurate and may differ from the actual price at any given market, meaning prices are indicative and not appropriate for trading purposes. Fusion Media and any provider of the data contained in this website will not accept liability for any loss or damage as a result of your trading, or your reliance on the information contained within this website.
It is prohibited to use, store, reproduce, display, modify, transmit or distribute the data contained in this website without the explicit prior written permission of Fusion Media and/or the data provider. All intellectual property rights are reserved by the providers and/or the exchange providing the data contained in this website.
Fusion Media may be compensated by the advertisers that appear on the website, based on your interaction with the advertisements or advertisers.
© 2007-2024 - Fusion Media Limited. All Rights Reserved.