Talking Points:
After a good European equity session, Asian markets seemed to heed the advice by Chinese authorities and loaded risk on the second day. This helped oil to bounce from an overnight slump and shore up copper, ASX, Nikkei and AUD, while it dampened Aussie government bonds.
China trade data for August came out before noon, with imports almost halved from -8.1% previously to -13.8%. This did not bode well for commodity demand outlook, commodity currencies or risk trades.
Following trade data, the Customs General Administration released preliminary August Commodity imports table with crude oil falling from 30.71 million tons previously to 26.59 million tons, whereas copper steadied at 0.35 million tons.
Oil continued to be jittery on the downside in response to macro news, while supply-demand imbalance arose again. The Paris-based International Energy Agency projected increase production from new projects in the North Sea, simultaneous to a re-open of Nigeria facility.
On the other hand, demand set to wane as European refineries entered seasonal maintenance during September-December. Although the drop is scaled back this year as Wood Mackenzie reported less shutdowns due to healthy margins and lagging supply of oil products, especially gasoline. High margin stemmed from cheap crude oil, refinery outage in Latin America and slow utilization of new facilities in the Middle East.
Copper stabilized above 2.3330 after a sharp rise met with profit-taking of long positions during European session. Despite a huge fall in overall imports, China’s copper imports matched with the previous two months and reinstated support for the metal.
But the biggest leverage came at the start of last European session where copper jumped 1.3 percent within less than an hour, after Glencore (OTC:GLNCY) announced an 18-month suspension at two African mines as the metal and oil producer struggled to cope with falling prices. This was calculated at approximately 2.2 percent cut in global supply and helped to level out stockpile surplus – nearly doubled this year per LME.
Gold has surprisingly traced the commodity complex throughout yesterday’s session, perhaps since a potential September US rate hike was sufficiently priced in and Friday’s mixed Non-farm Payrolls failed to provoke new interests. The precious metal stayed flat during Asian session while oil and metals reacted negatively to China imports. However volatility will likely return later as the US market peruses China trade data and last week’s Non-farm Payrolls.
GOLD TECHNICAL ANALYSIS
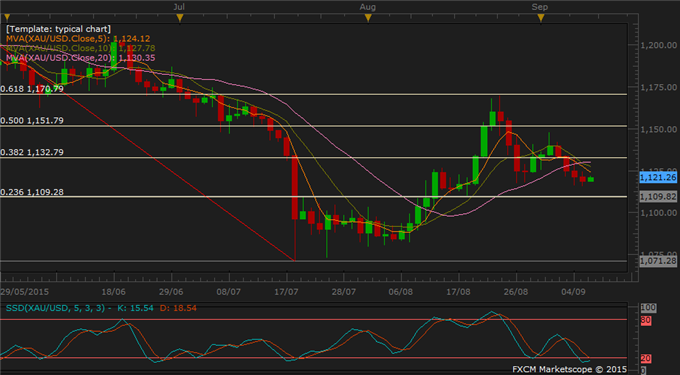
As noted in our last report, gold halted the recent descent ahead of 23.6% Fibo at 1109.3 and momentum signals are poised to bounce back after hitting lower bound. However upside potential remains weak as the modest gains so far have not built up enough for an upturn. Moreover, topside is capped by firm resistance at 20-day moving average and 38.2% Fibo around 1130-1132.

COPPER TECHNICAL ANALYSIS
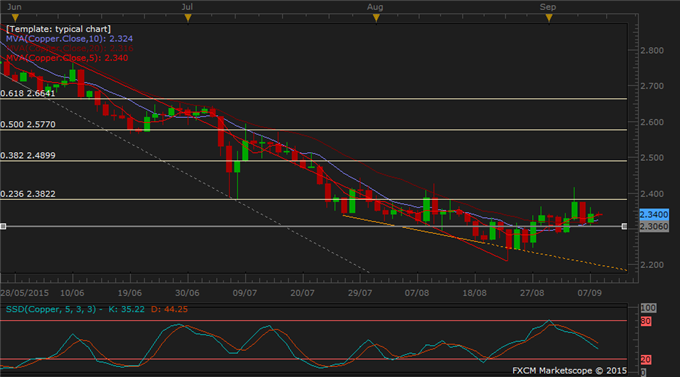
Copper vied for 23.6% Fibo at 2.3822 yet so far has failed to rise above it. The metal is ranging with sticky downward momentum signals throughout early September’s correction. An immediate support level can be found at 2.3330 today, followed by 2.3060 below that.

CRUDE OIL TECHNICAL ANALYSIS
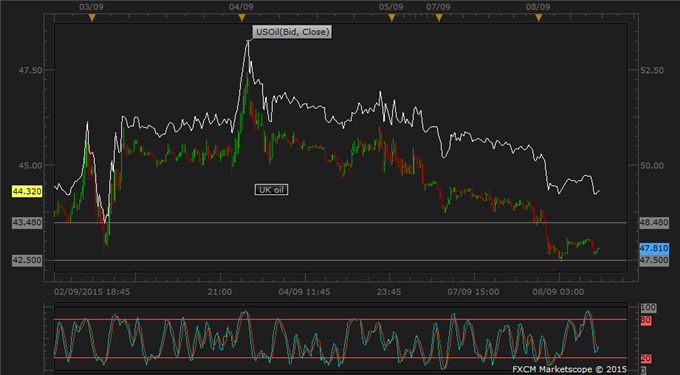
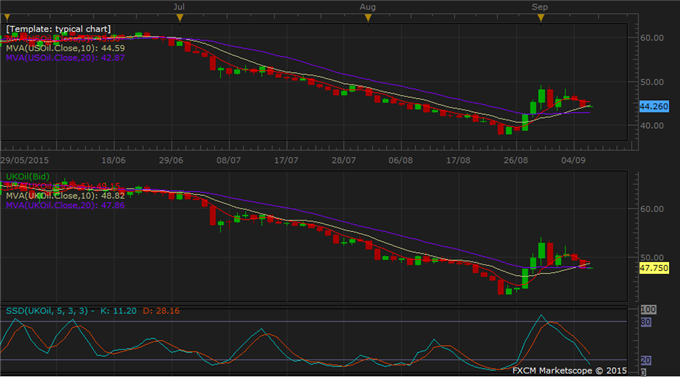
WTI and Brent oil pared today’s gains to test multi-day lows at 44.14 for WTI (also its opening level), and 47.50 for Brent. Contests of support may repeat today as volatility builds up after a long US weekend. Downward momentum signals on the daily chart show that the downside of both oil indicators remains fragile to macro developments, particularly Brent after it dipped below 20-day moving average yesterday.


