Get 40% Off
🚨 Volatile Markets? Find Hidden Gems for Serious OutperformanceFind Stocks Now

Lost In Space

Published 05/12/2015, 12:37 AM
Updated 07/09/2023, 06:31 AM

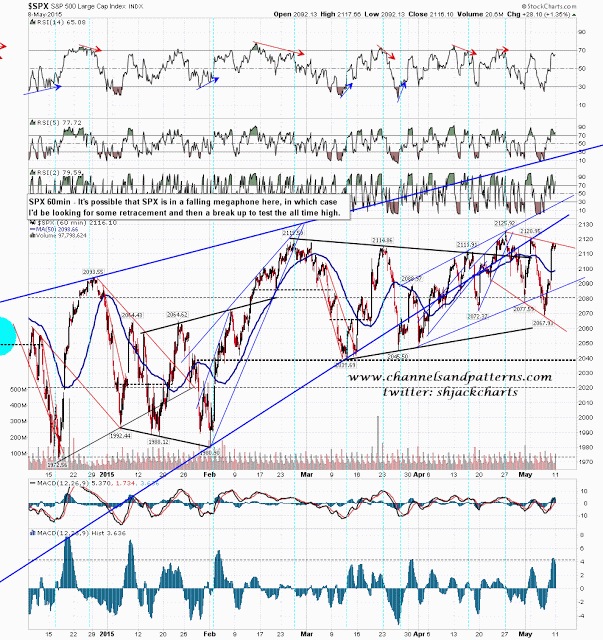
I think I now have the pattern for this wildly choppy action over the last few days, and it's a falling megaphone that looks likely to break up soon, though we may well see a decent retracement before any test of the all time high. SPX 60 min chart:
S&P 500 1 Hour Chart

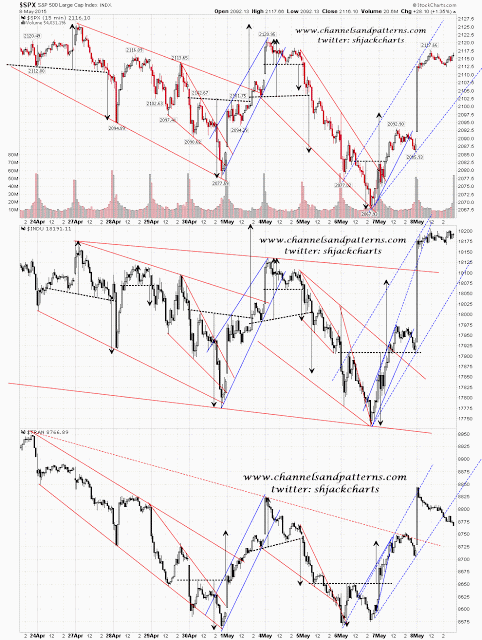
Looking at the scan charts TRAN is still the weakest with the obvious target for the current retracement on SPX at 2105 (rising target obviously). A break below that would open up targets lower down, with the daily middle band at 2102 and the 50 hour MA at 2099. On a significant break under the 50 hour MA we could see another of the hard spikes down that have dominated the last couple of weeks. Scan 3x SPX INDU TRAN chart:
S&P 500 15 Minute Chart

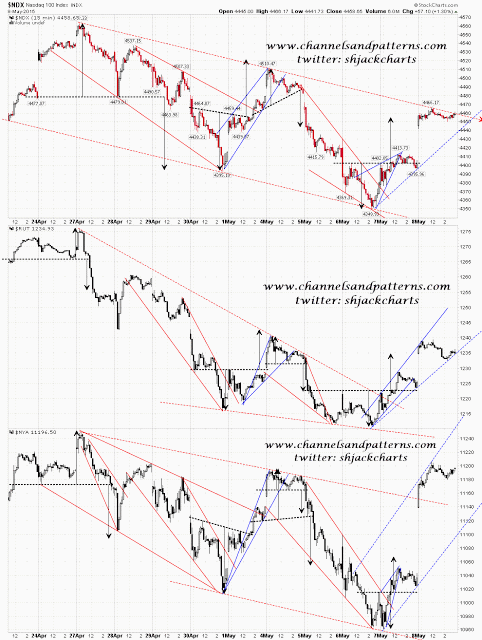
NDX and RUT are already testing rising support from the last lows. If that breaks that looks moderately bearish but I'd be looking for SPX to break hard before assuming another spike down had started. Scan 3x NDX RUT NYA chart:
NDX 15 Minute Chart

This has been very spiky tape the last few days and it would be very nice to see it resolve into a decent trend move in either direction. Meantime we will just have to wait for this already lengthy topping process to complete.

Original post

Latest comments

Risk Disclosure: Trading in financial instruments and/or cryptocurrencies involves high risks including the risk of losing some, or all, of your investment amount, and may not be suitable for all investors. Prices of cryptocurrencies are extremely volatile and may be affected by external factors such as financial, regulatory or political events. Trading on margin increases the financial risks.
Before deciding to trade in financial instrument or cryptocurrencies you should be fully informed of the risks and costs associated with trading the financial markets, carefully consider your investment objectives, level of experience, and risk appetite, and seek professional advice where needed.
Fusion Media would like to remind you that the data contained in this website is not necessarily real-time nor accurate. The data and prices on the website are not necessarily provided by any market or exchange, but may be provided by market makers, and so prices may not be accurate and may differ from the actual price at any given market, meaning prices are indicative and not appropriate for trading purposes. Fusion Media and any provider of the data contained in this website will not accept liability for any loss or damage as a result of your trading, or your reliance on the information contained within this website.
It is prohibited to use, store, reproduce, display, modify, transmit or distribute the data contained in this website without the explicit prior written permission of Fusion Media and/or the data provider. All intellectual property rights are reserved by the providers and/or the exchange providing the data contained in this website.
Fusion Media may be compensated by the advertisers that appear on the website, based on your interaction with the advertisements or advertisers.
© 2007-2024 - Fusion Media Limited. All Rights Reserved.