Get 40% Off
⚠ Earnings Alert! Which stocks are poised to surge?
See the stocks on our ProPicks radar. These strategies gained 19.7% year-to-date.
Unlock full list

Gold, Silver, Oil, USD, Yields: March Outlook

Published 03/01/2015, 12:16 AM
Updated 07/09/2023, 06:31 AM

Not surprising - considering the surge in the dollar since last summer, headline CPI for January posted its biggest drop since 2008 last Thursday, falling 0.7% in January. Core CPI, however, exceeded expectations and rose 0.2% last month.

The chart below that we've shared since last fall, shows U.S. 3-Month Treasury yields less headline and core CPI (hashed), which has closely trended with the dollar - except with a lag of several months. Despite the rise in February in core CPI, we expect to see more soft inflation data as the move in the dollar is further absorbed downstream.
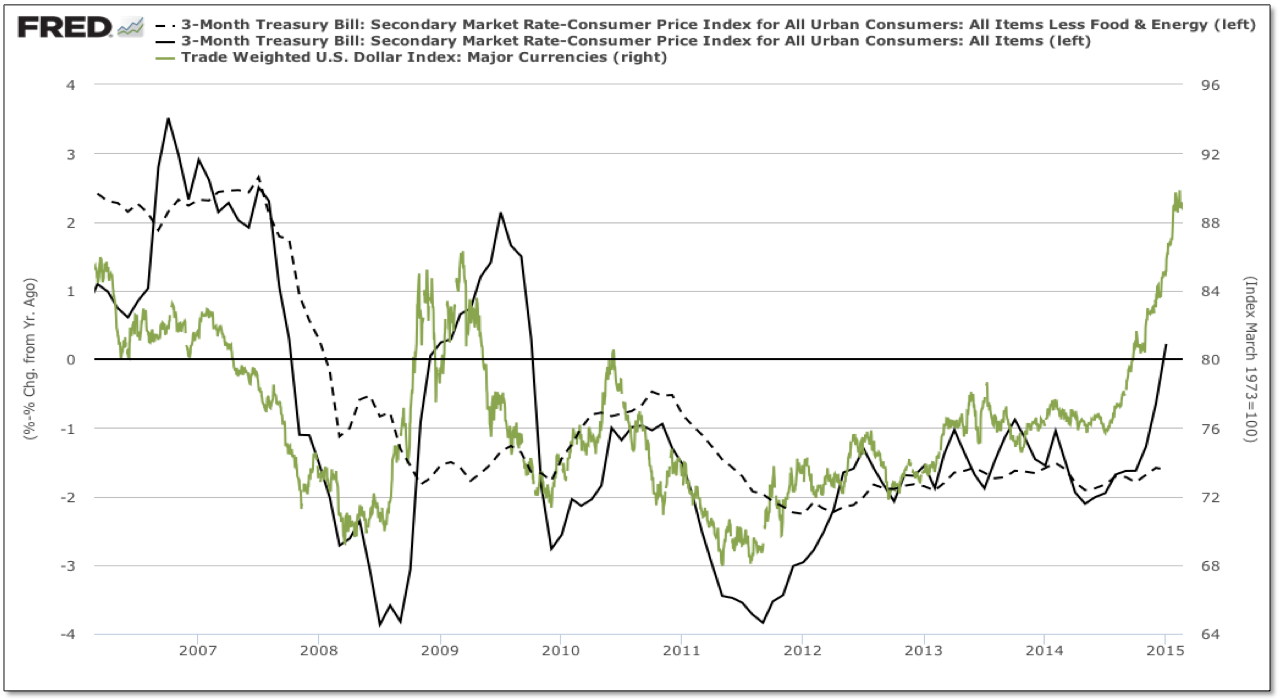
3-M Treasury Yield Less Headline, Core CPI vs USD Index 2007-2015

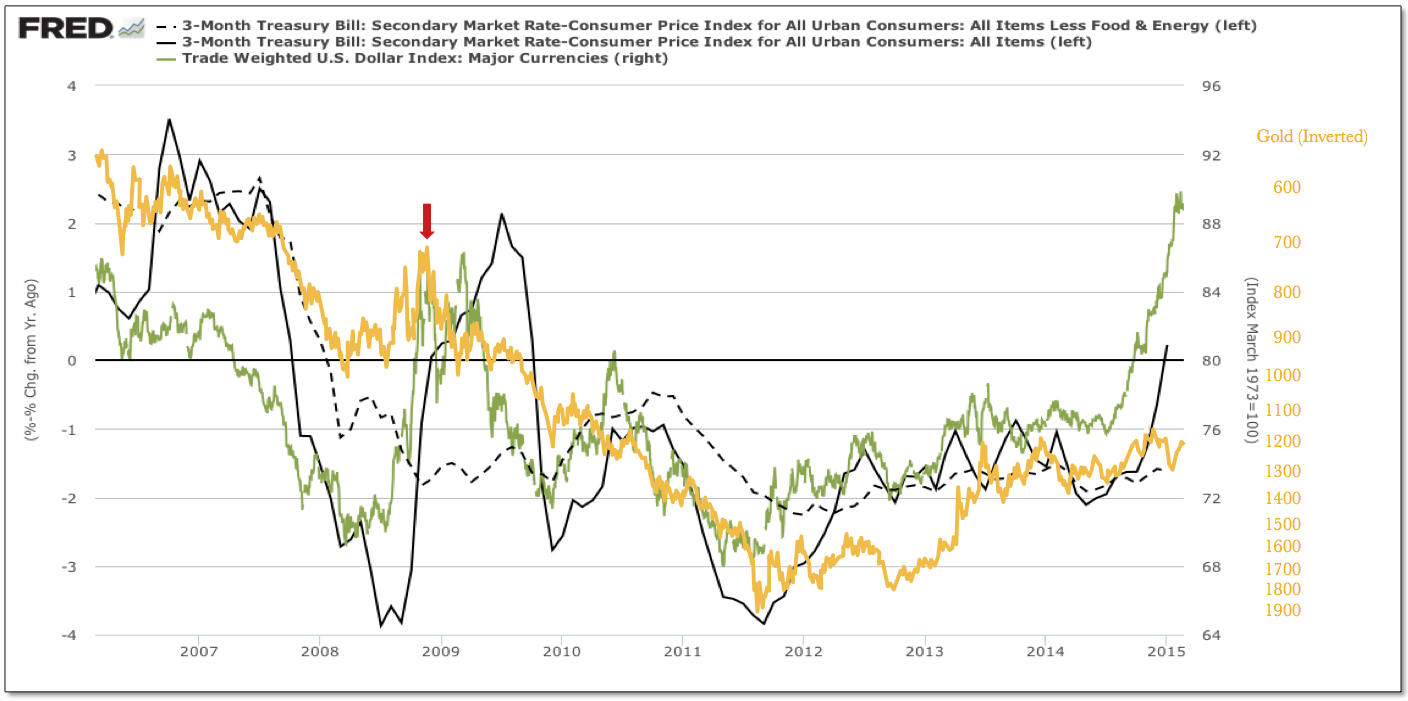
That said, we still view the reversal in gold last fall as a leading indicator of the inflation vane shifting north and look back at the more acute 2008/2009 deflationary impulse for reference - which also saw precious metals leading the pivot in the dollar and inflation expectations.

This time around, the cycle has been more gradual, broader and shallower - but unfurling with similar dynamics between markets and asset classes. All things considered, we still very much like the prospects for gold and Silver this year. 3-M T-Yield Less Headline, Core CPI vs USD, Gold 2007-2015
Since exhausting at the end of January, inflation protected securities have outperformed nominal Treasuries, following in the steps of gold and silver that pivoted higher roughly three months before. TIP:TLT Weekly 2008-2009 vs 2015-2015
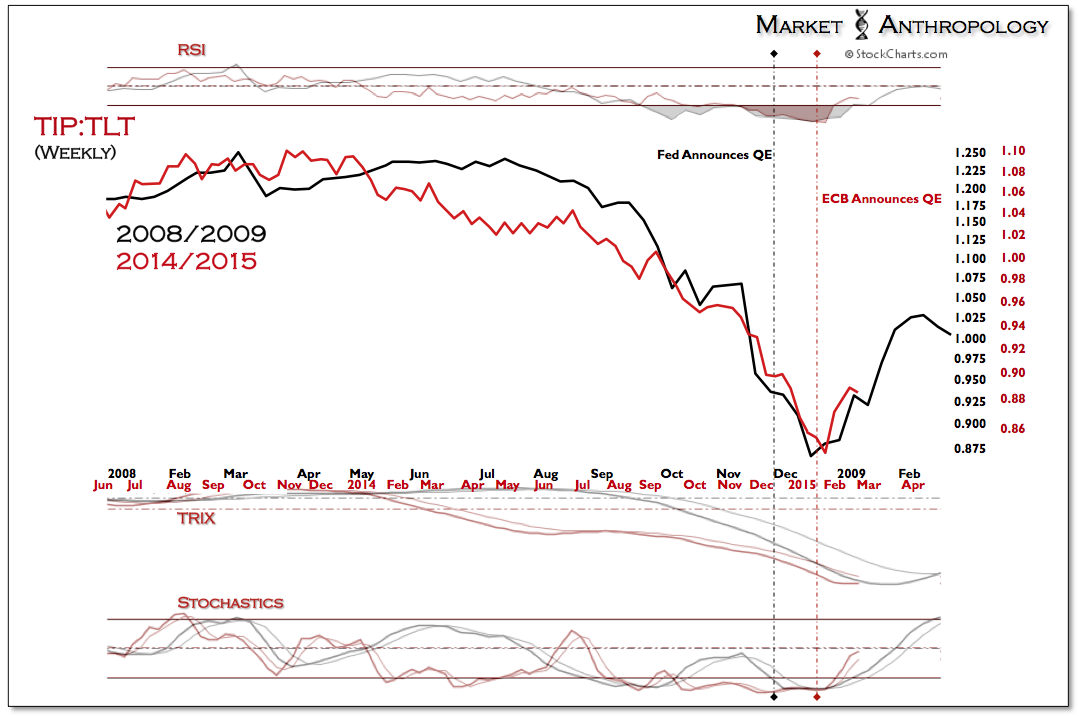
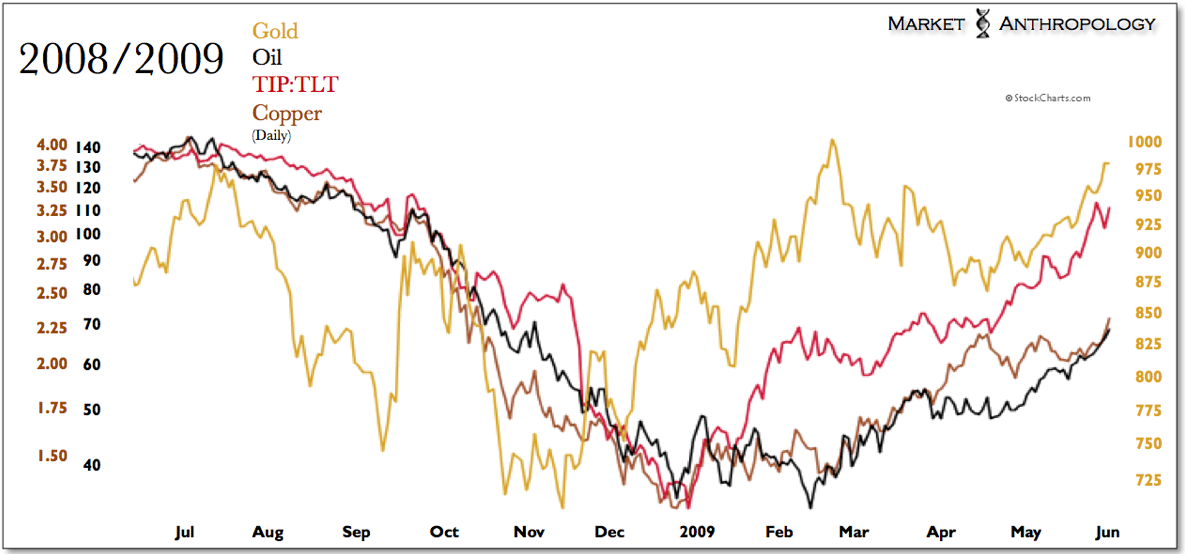
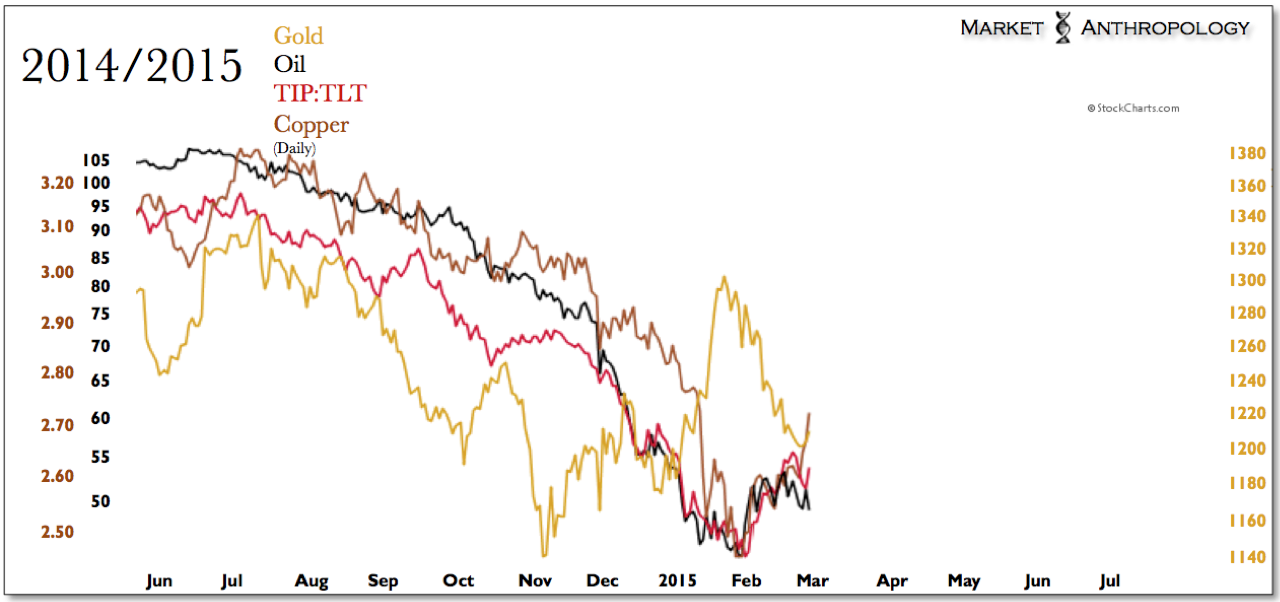
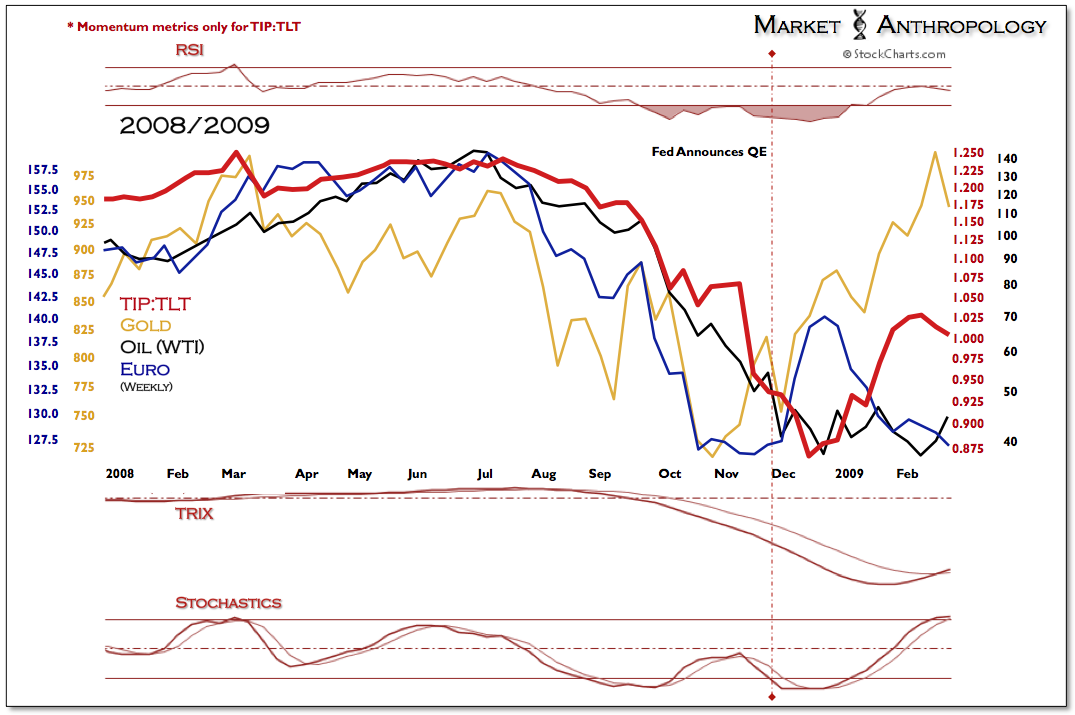
Similar to the reversals in reflationary trends going into 2009, the latent pivot higher in the TIP):TLT) ratio has also been made by markets such as copper and oil - which bounced roughly 10 and 20 percent, respectively, over the past month. A significant difference this time around has been the steady decline in the euro, versus a more broad and volatile structure of its low in 2008/2009.
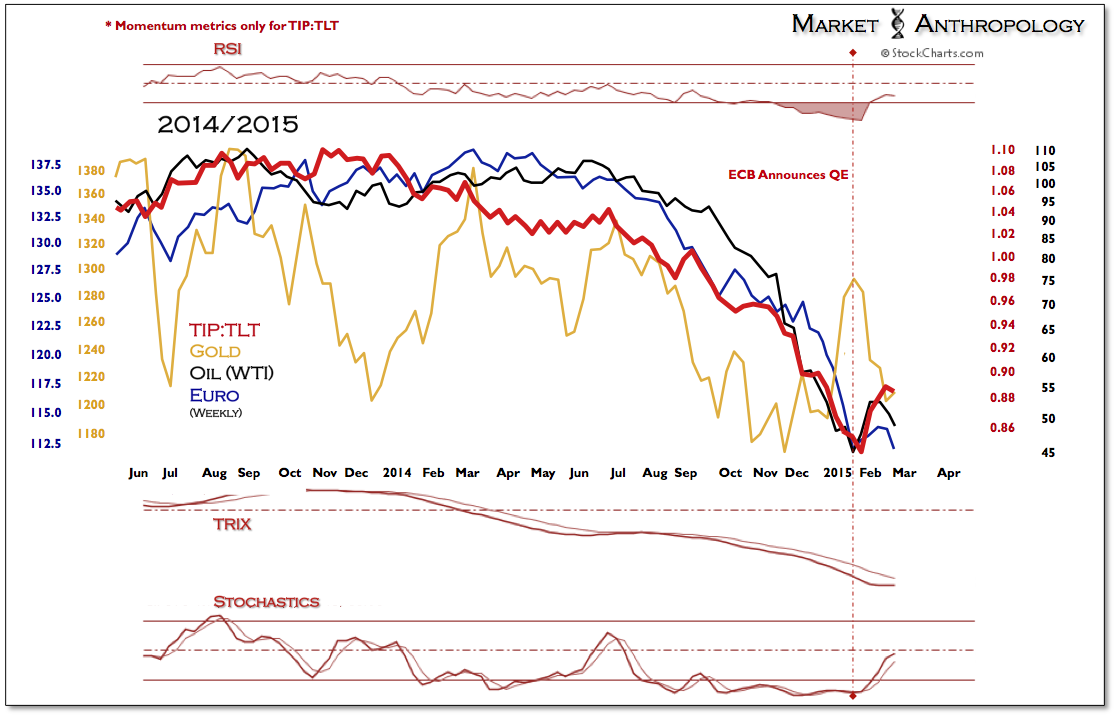
TIP:TLTvs Gold vs Oil vs Euro Weekly 2014-2015

TIP:TLTvs Gold vs Oil vs Euro Weekly 2008-2009
Daily Gold vs Oil vs TIP:TLT vs Copper 2008-2009Daily Gold vs Oil vs TIP:TLT vs Copper 2014-2015
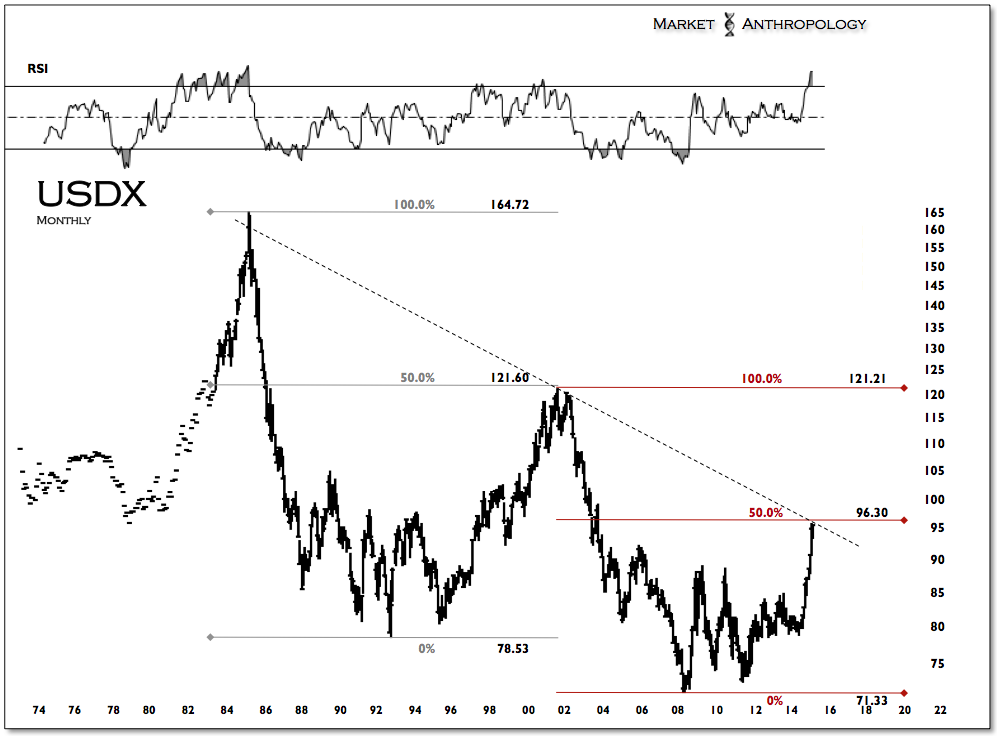
The U.S. dollar index is closing out February near its long-term 50 percent retracement high, which also serves as overhead trend line resistance from the July 2001 50 percent retracement high. As mentioned in previous notes, we expect the dollar to follow the lag in 10-year yields and back into the trough of its long-term range. USDX Monthly 1974-Present
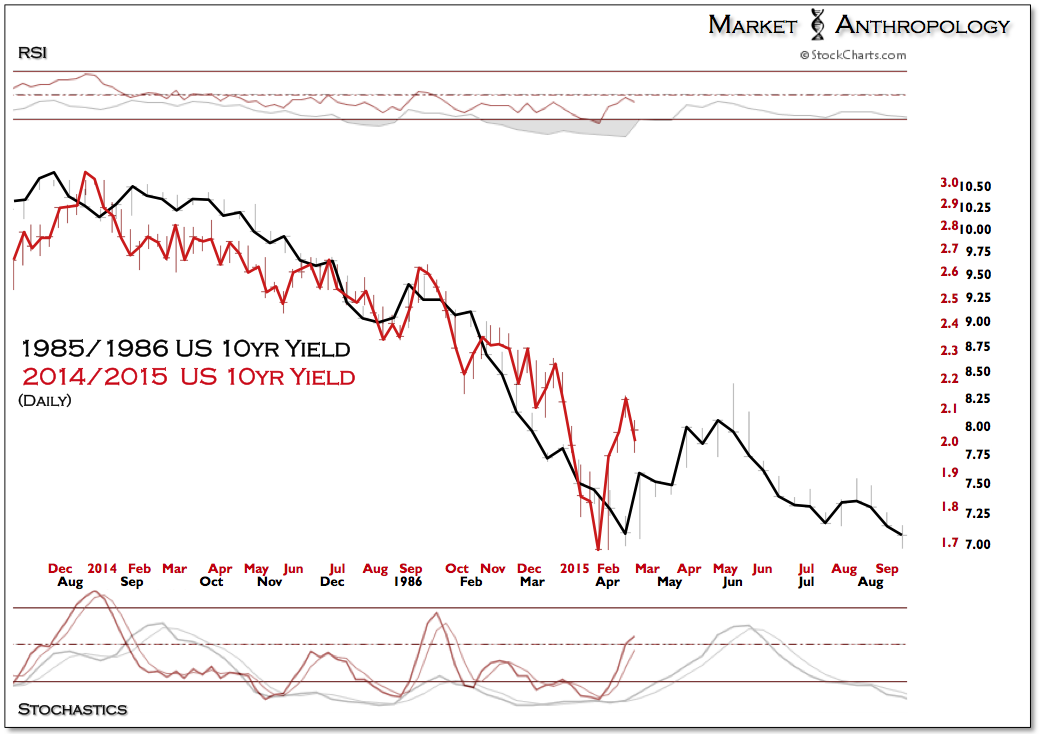
The euro, however, appears poised to follow the current uptrend in U.S. 10-year yields and out of a trough low that's been tested over the past month. Similar to the lagged affect on yields from QE in the U.S. in late 2008, we expect the measures introduced by the ECB last month to begin to buttress European yields and the euro in March.
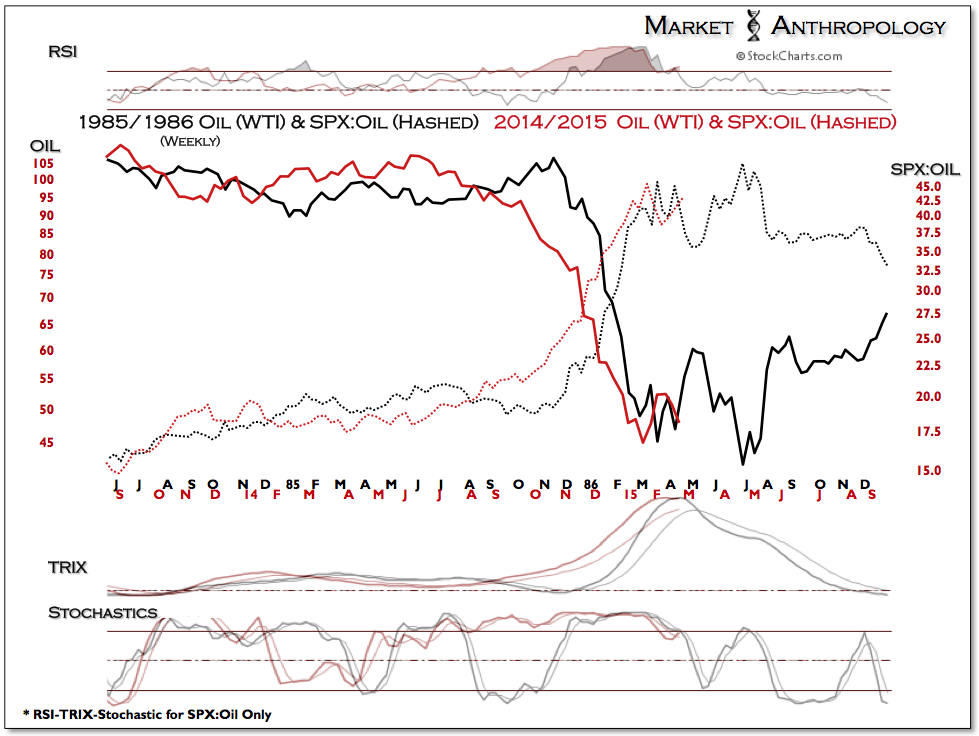
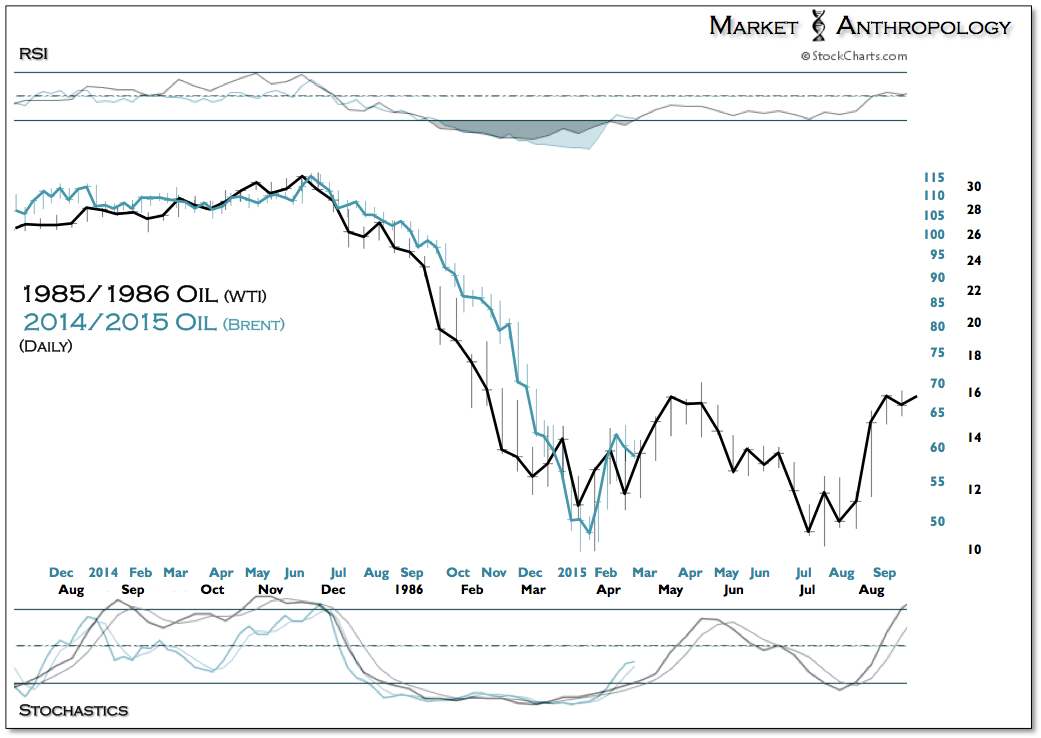
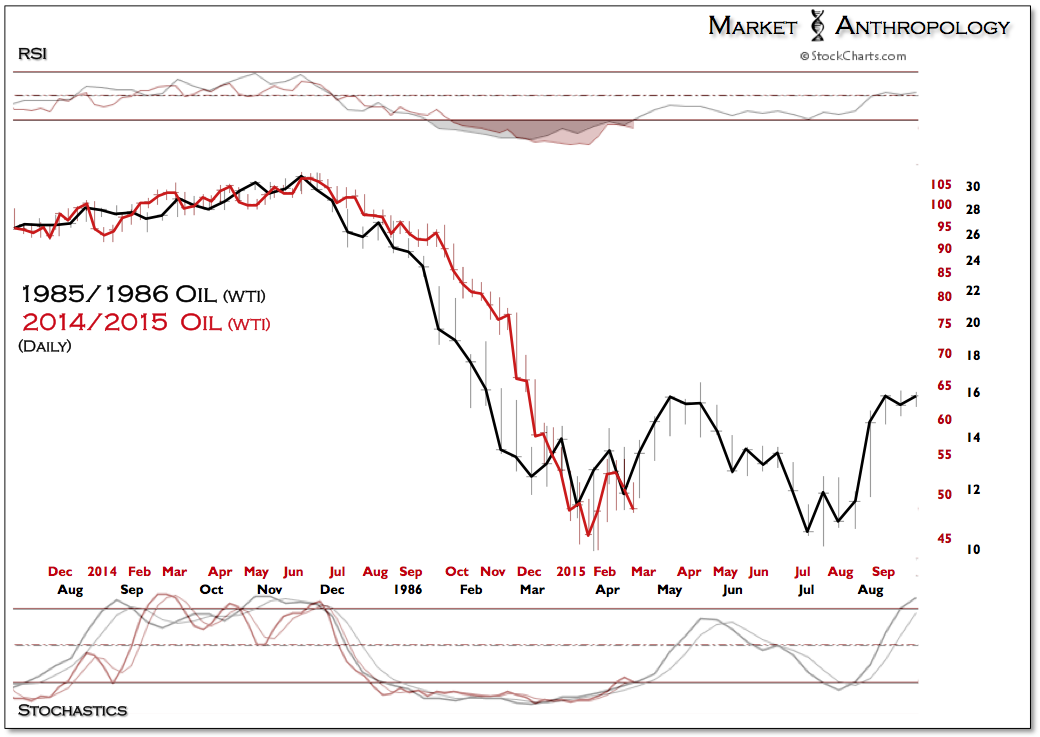
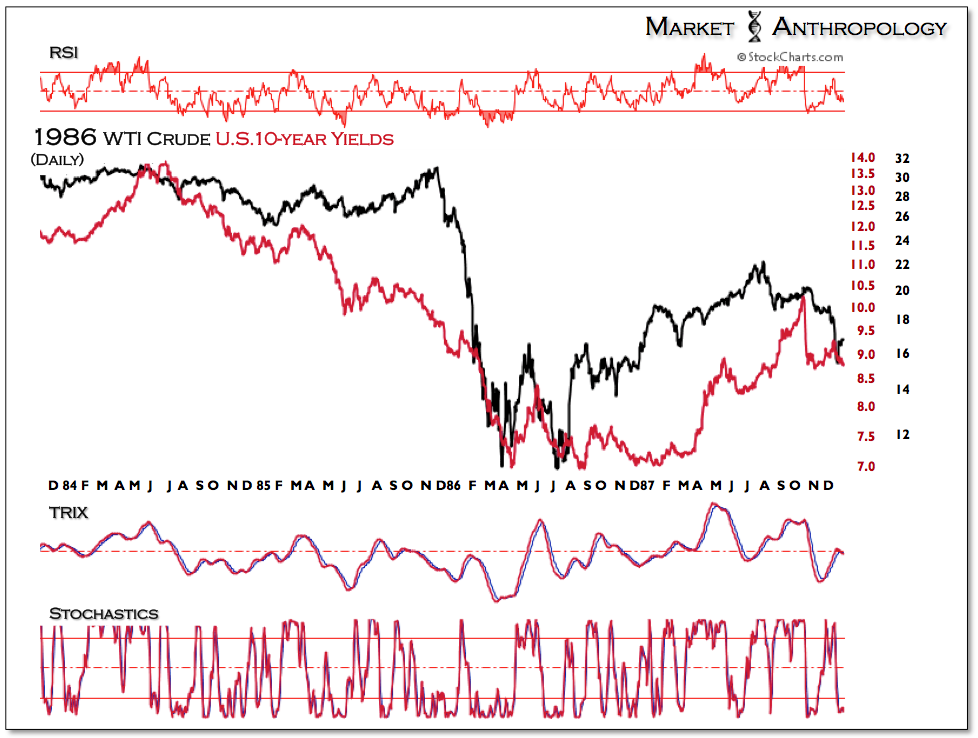
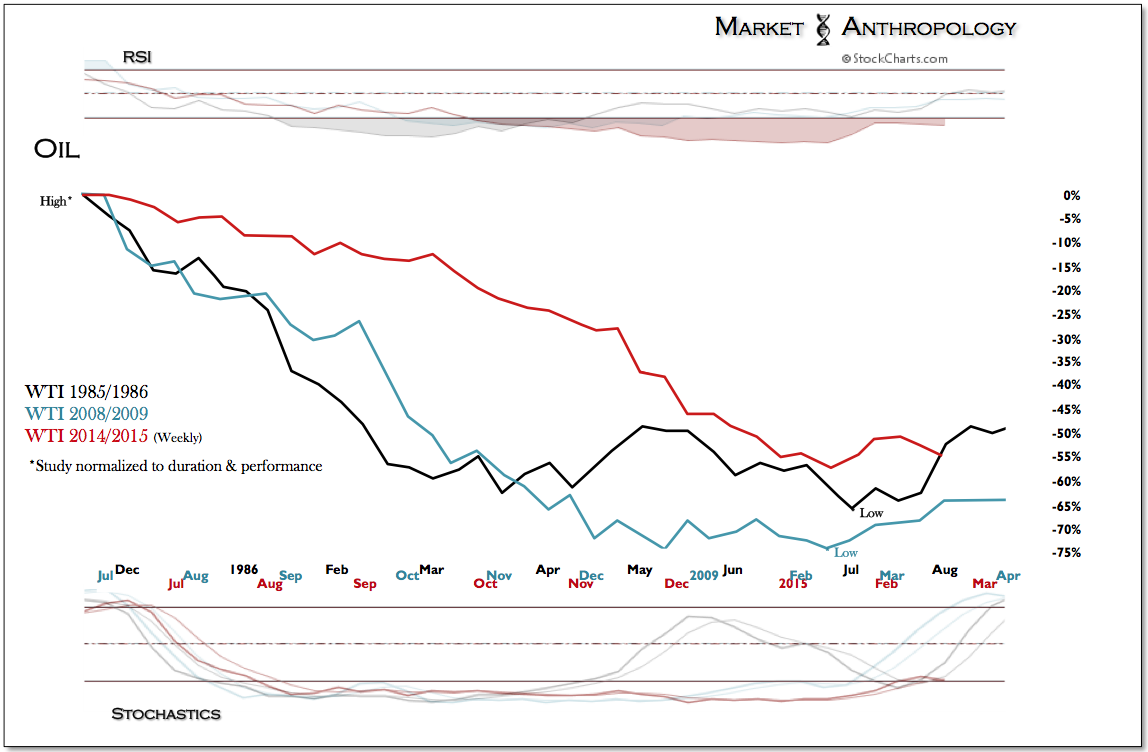
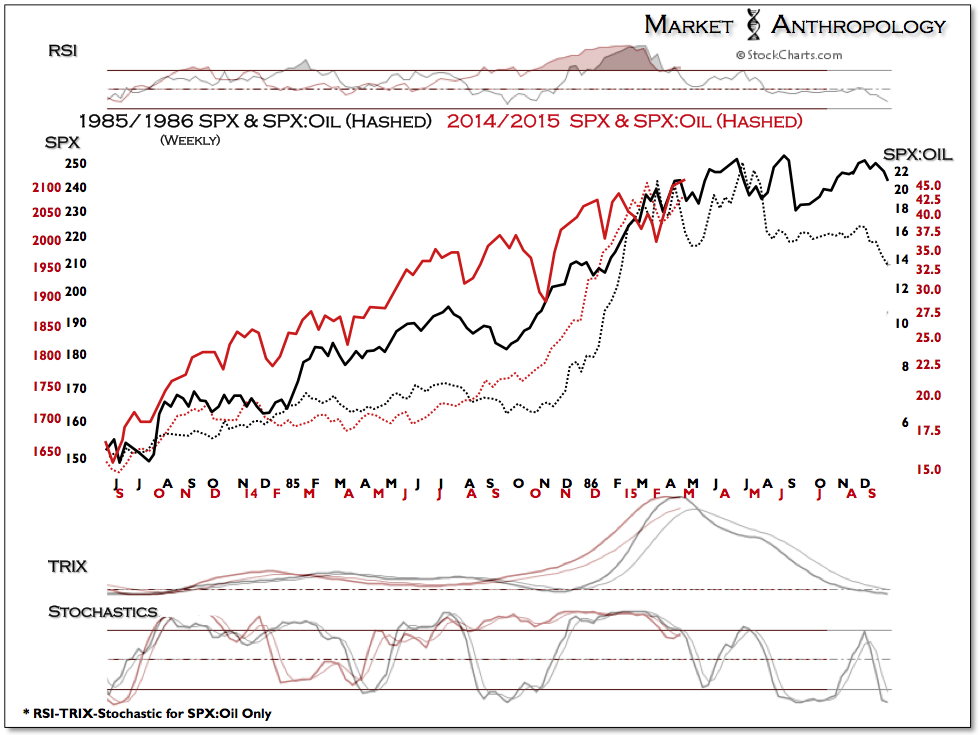
Outstanding of the oil crash in 2008, we have also closely followed the markets in relation to the supply driven decline in oil in late 1985 into 1986, which was primarily driven by a sluggish global economy while non-OPEC North Sea oil countries had increased production. Although there are similarities to what North American shale production has contributed to the global supply of oil, the 1985/1986 time period has been on our radar for years as a prospective mirrored shoulder in the pattern below of the SPX:Oil ratio.
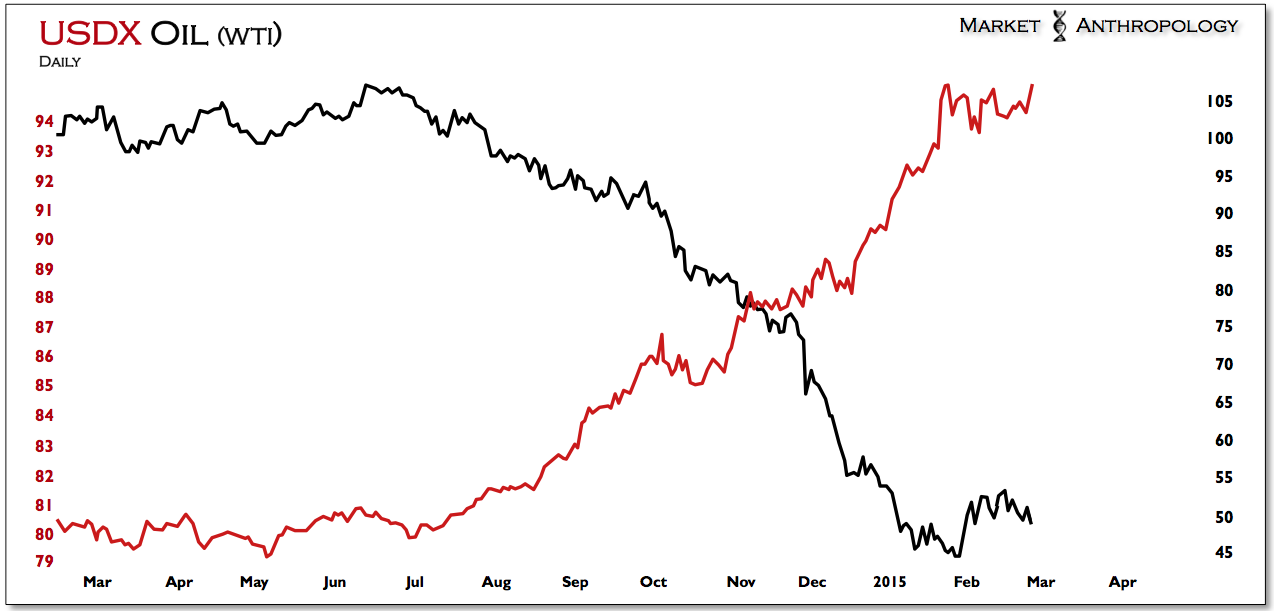
USDX vs Oil Daily

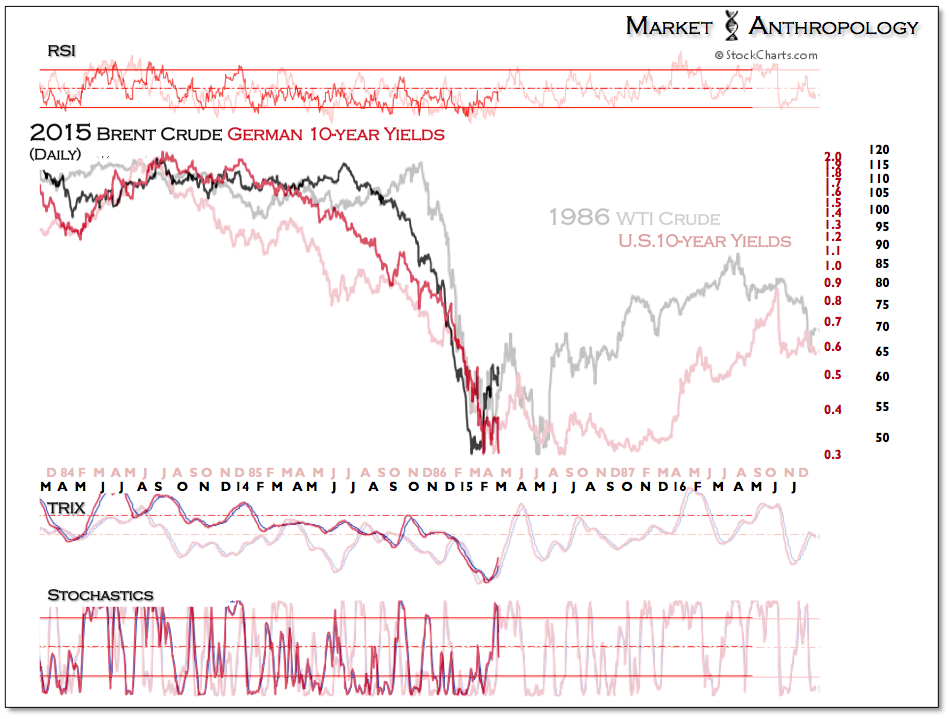
Moreover - and quite dissimilar to 1985/1986, we feel the current move has been primarily driven by the currency markets, although there are similarities in monetary policy that helped fuel the rebound in oil in the back half of 1986.

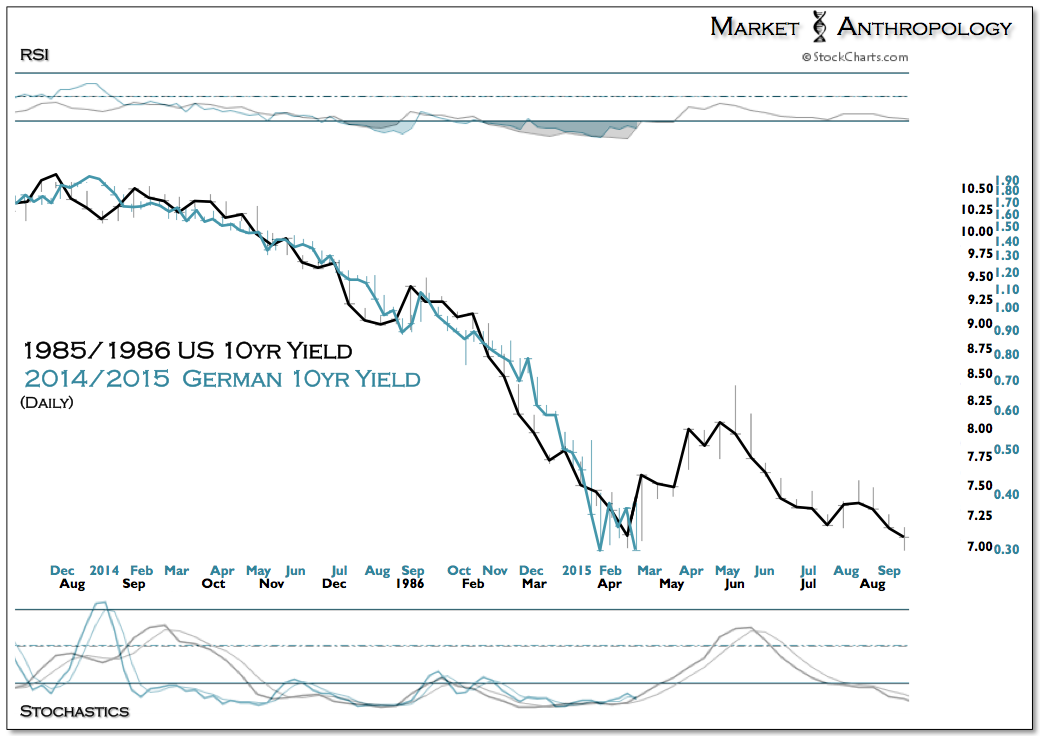
While it was the Fed that eased aggressively in the first half of 1986, today it's two of the other major players in the balance of the global economy (Europe, China) that are loosening policy that should support a rebound in oil - as well as those markets that have contributed and correlated with its decline. E.g. - the euro and European yields.
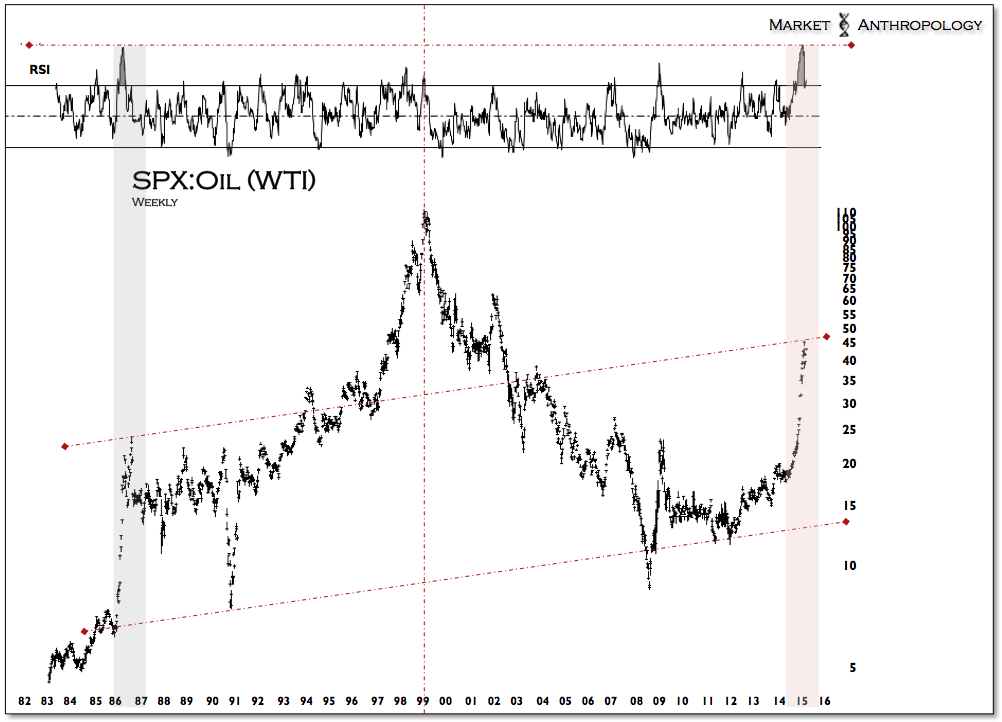
SPX: Oil Weekly 1982-Present

1985/1986 vs 2014/2015 Oil vs SPX:Oil Weekly

1985/1986 vs 2014/2015 Weekly SPX and SPX:Oil

1985/1986 WTI vs 2014/2015 Brent, Daily 1985/1986 Oilvs 2014/2015 Oil Daily 1985/1986 US 10-Y vs 2014/2015 German 10-Y, Daily 1985/1986 US 10-Y vs 2014/2015 US 10-Y Daily 2015 Brent vs German 10-Y overlayed 1986 Crude vs US 10-Y 1986 Crude Oil vs US 10-Y DailyOil Weekly: 1985/1986 vs 2008-2009 vs 2014-2015

Latest comments

This guy's some kinda commodities/PM perrmabull. The last time he told traders to buy gold was February 1, when it was around 1280 and today it's dipping under 1200. . http://www.investing.com/analysis/traders:-sell-stocks---bonds---buy-gold---silver-240909. . Good traders don't go against strong trends, especailly not for some academic story line. That's for ivory tower people, not real traders. . . Avoid his adviice like the plague. Him and Tommy Humphreys on gold. (Do the complete opposite of whatever Tommy says)
gold 'n silver only going one way, down to the bottom of the sea!
Can be describe in 3 words for GOLD "SELL ON RISE"
Risk Disclosure: Trading in financial instruments and/or cryptocurrencies involves high risks including the risk of losing some, or all, of your investment amount, and may not be suitable for all investors. Prices of cryptocurrencies are extremely volatile and may be affected by external factors such as financial, regulatory or political events. Trading on margin increases the financial risks.
Before deciding to trade in financial instrument or cryptocurrencies you should be fully informed of the risks and costs associated with trading the financial markets, carefully consider your investment objectives, level of experience, and risk appetite, and seek professional advice where needed.
Fusion Media would like to remind you that the data contained in this website is not necessarily real-time nor accurate. The data and prices on the website are not necessarily provided by any market or exchange, but may be provided by market makers, and so prices may not be accurate and may differ from the actual price at any given market, meaning prices are indicative and not appropriate for trading purposes. Fusion Media and any provider of the data contained in this website will not accept liability for any loss or damage as a result of your trading, or your reliance on the information contained within this website.
It is prohibited to use, store, reproduce, display, modify, transmit or distribute the data contained in this website without the explicit prior written permission of Fusion Media and/or the data provider. All intellectual property rights are reserved by the providers and/or the exchange providing the data contained in this website.
Fusion Media may be compensated by the advertisers that appear on the website, based on your interaction with the advertisements or advertisers.
© 2007-2024 - Fusion Media Limited. All Rights Reserved.