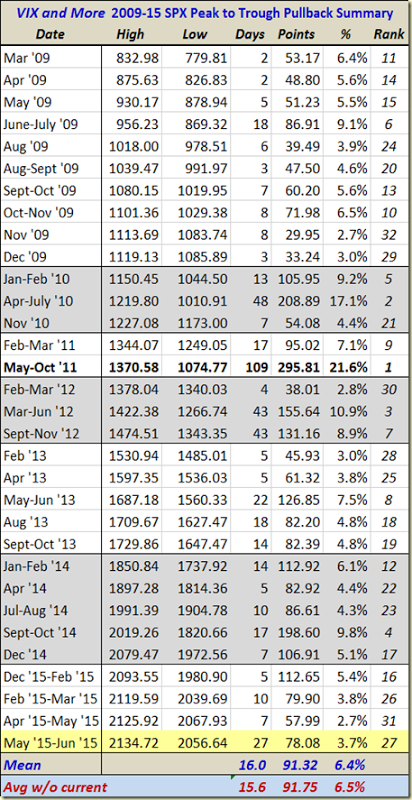
I have been quiet in this space as of late, but there is nothing like a 34% one-day spike in the VIX to inspire me to dust of the cobwebs and get this place humming again. I will start by updating an old favorite table that invariably is the subject of many requests whenever stocks begin to show signs of a meaningful pullback, as is the case today.
Note that the table below includes only pullbacks from all-time highs and only those that go back to the March 2009 bottom. Here 2.75% seems to be a natural cutoff, but I am more apt to include smaller numbers if it took a relatively large number of days to arrive at the bottom. Seen in this light, today’s 2.09% decline in the S&P 500 Index brings the aggregate peak-to-trough decline to 3.7%, but perhaps the most interesting number is that it took a full 27 trading days to realize that 3.7% drop. In fact, no peak-to-trough decline has taken longer to materialize since a pair of 43-day moves from late 2012 that resulted in 8.9% and 10.9% declines. Of course, there is no reason to believe that today is a bottom, but then again, there have been only four longer-lasting pullbacks since the current bull market started over five years ago.

Depending upon whether one attributes the current pullback to China, Greece, Puerto Rico or more nebulous factors as valuation, time without a correction, etc. one might draw different conclusions about the path forward. Personally, I see China as the biggest culprit, followed (at least today) by Puerto Rico and then Greece. What concerns me most is that the issues in China and Puerto Rico are no less thorny or difficult to resolve than they are in Greece.
For what it is worth, while I think it is important to understand the age of a bull market as a partial proxy for vulnerability, I do not subscribe to the theory that a healthy market needs a 10% correction every x months or y years. Further, did the 9.8% peak-to-trough decline in the S&P really need another 0.2% to reset some sort of magical market-timing sundial? (Don’t forget that both the Nasdaq 100 and Russell 2000 did hit that threshold during the same period.)
In technical analysis, the time for a move to unfold is sometimes almost as important as the magnitude of the move. In another week or so, we should know whether the current price action is just a slow-motion, short and shallow dip or perhaps the first signs of a deeper and more painful countertrend – and the best part is that we don’t even need a referendum to decide the matter.
Disclosure(s): none
