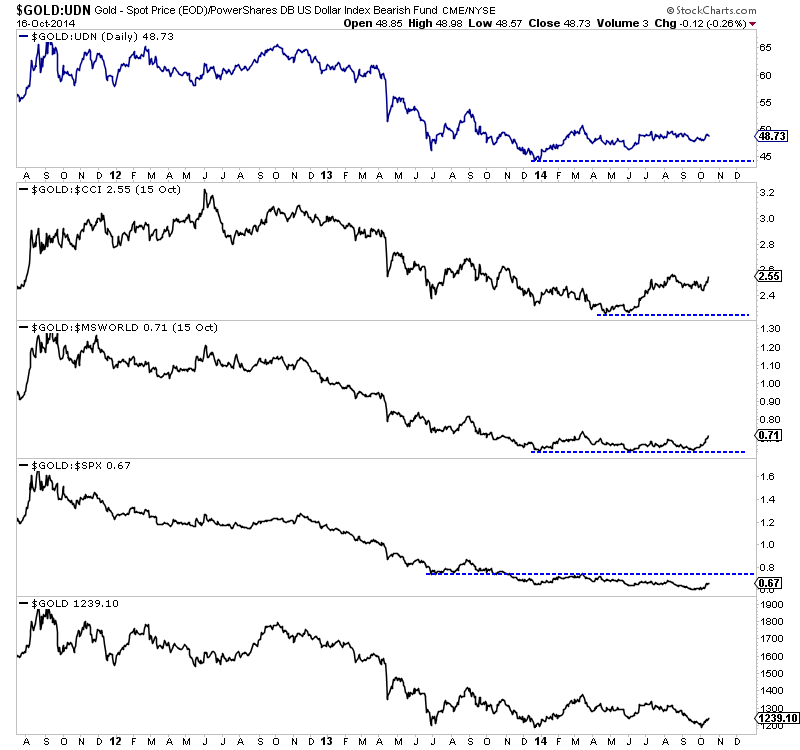
Gold is currently getting a reprieve as it trades close to $1240, which is above important weekly support at $1200. It’s safe for the time being but we believe that Gold will ultimately break back below $1200 and below $1100 before the end of the already long-in-the-tooth bear market. Because Gold is somewhat of an anti-asset, it’s important to chart its course against other asset classes. Gold performs best when its strong against all other classes. Moreover, prior to recent important bottoms, Gold bottomed first against other classes before bottoming in nominal terms. It appears that could happen again.
The First To Bottom
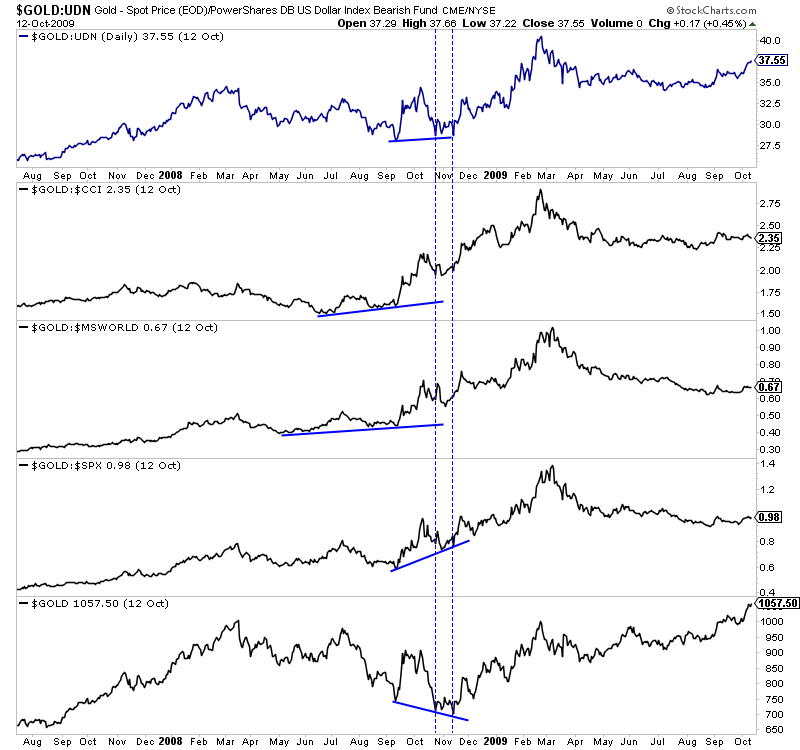
The first chart looks back at the 2008 bottom. We plot Gold against foreign currencies, commodities, global equities and the S&P 500. Gold’s lowest tick was late October 2008 while its daily low was in November 2008. Against other asset classes, Gold bottomed before then. Gold bottomed against foreign currencies and the S&P 500 in September while bottoming against global equities in May and commodities in June.
We should also note that while Gold bottomed in April 2001, it bottomed in real terms (against foreign currencies, equities and commodities) months before then.
Showing Strength
Let’s look at the same charts today. While Gold has only recently emerged from a weak triple bottom, it is showing more strength against the other asset classes. Against foreign currencies, Gold is nearly 10% above the December 2013 low. Gold is very close to an 11-month high against commodities and is trading at a 7-month high against global equities. Gold remains weak against the S&P 500.
Going forward there are a few things we will be watching. Assuming Gold breaks back below $1200 and eventually below $1100, will it be able to hold these recent lows against the other asset classes? If yes, then that will show that though Gold is declining, it is maintaining the kind of relative strength that was in place at previous major bottoms. Secondly, the Gold vs. S&P 500 ratio is very important. U.S. equities and precious metals have been on a divergent course since the summer of 2011. If we get a weekly close in the ratio above 0.75 then it would signal a major turning point in favor of Gold.
The Miners
In the meantime we would advise continued caution. Gold and Silver have bounced -- but only from an extreme oversold condition. Though Gold has rallied $50/oz, the miners have done nothing. The large caps -- GDX and HUI -- are trading dangerously close to recent lows while the juniors -- GDXJ -- have tread water at best. They are hinting that this rally won’t last.
Stand aside for the time being as I see a potential lifetime buying opportunity emerging in the months ahead.

