Get 40% Off
🚨 Volatile Markets? Find Hidden Gems for Serious OutperformanceFind Stocks Now

Late Selling Leaves Markets At A Crossroads.

Published 10/17/2016, 12:15 AM
Updated 07/09/2023, 06:31 AM

The follow through from Thursday's buying burned out after the first hour of Friday's trading and Friday closed back at Thursday's close. Where Thursday's action had set up for upside follow through, Friday's 'inverse hammer' is offering the reverse. The question is how strong the respective buying and selling which created the spikes from Thursday and Friday are? Monday is likely to start with a test of Thursday's buying. What happens after the first half hour of trading will set the tone for the rest of the day.

The S&P 500 is trading below 20-day and 50-day MAs. Thursday's selling was greater than Friday's buying which is another tick in the bear column. Technicals are all negative. The only positive was the relative out performance of the index to the Russell 2000.
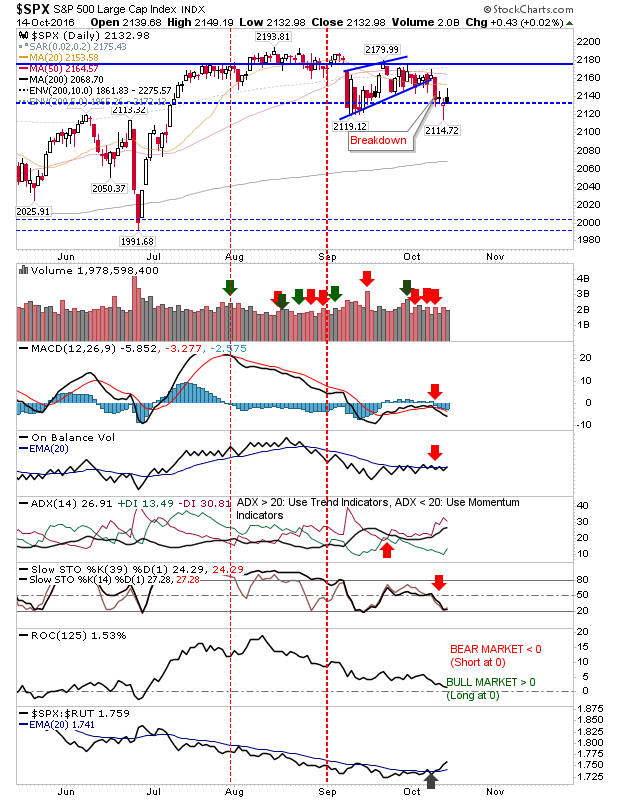
S&P 500 Daily Chart

The NASDAQ rebounded off its 50-day MA as buying volume traded below Thursday's selling volume (like the S&P). Bulls can look to the mid-line test of Stochastics as a possible launching point for a rally. Bears will want an expansion in the new relative underperformance of the index against the S&P.
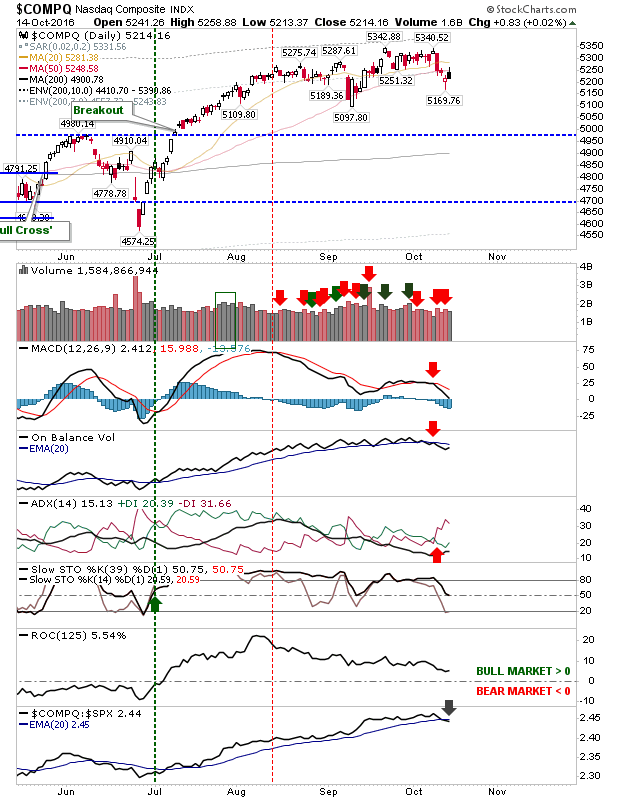
COMPQ Daily Chart


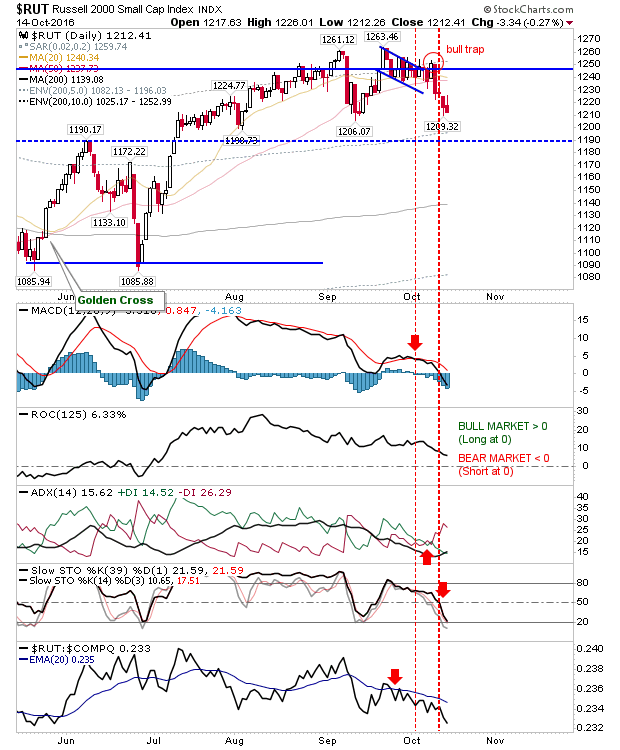
The Russell 2000 is in the worst position. The index is pressuring Thursday's low, leaving bulls with little room for maneuver. A weak start for this index will make it difficult for bulls in the S&P an Nasdaq to step in and defend Thursday's lows, and for buyers from Thursday to hold their positions. Look to the Russell 2000 for leads in all markets
3rd party Ad. Not an offer or recommendation by Investing.com. See disclosure here or remove ads .

RUT Daily Chart
The longer term picture has become slightly more mixed.

Bulls can look to the Dow Theory indicator as Transports continue their performance breakout. The trend remains down, but the acceleration lower which started in 2015 has been negated. If current action can make it past the hashed red-line it will mark a new leadership role for transports which would point to improving economic conditions.
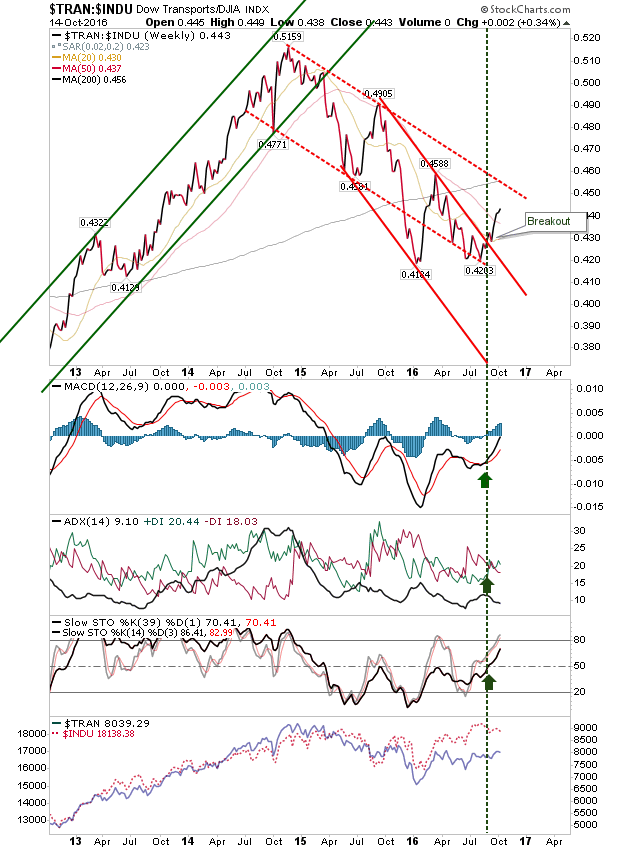
TRAN-INDU Weekly Chart


Meanwhile the relationship between Consumer Discretionary Select Sector SPDR (NYSE:XLY) and Consumer Staples Select Sector SPDR (NYSE:XLP) stocks - on a monthly time frame - hasn't changed from its bearish stance.
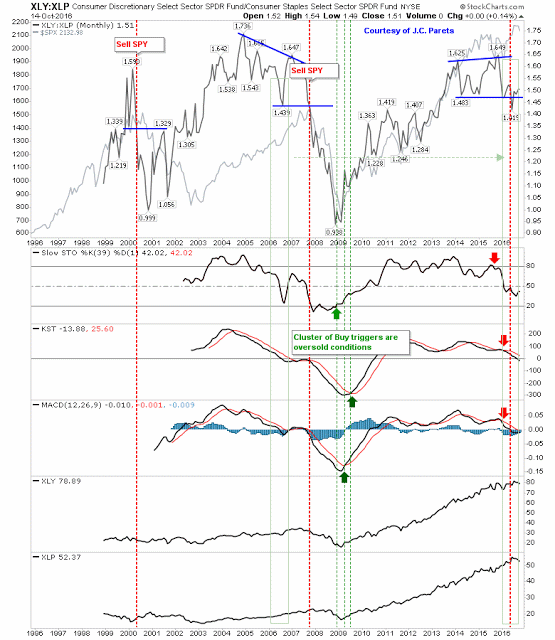
XLY-XLP Monthly Chart


Early action Monday is likely to be telling. Hunch thinks bears will win out, but buyers have reasons for optimism with markets so close to posting new 52-week, and all-time highs.

Latest comments

Risk Disclosure: Trading in financial instruments and/or cryptocurrencies involves high risks including the risk of losing some, or all, of your investment amount, and may not be suitable for all investors. Prices of cryptocurrencies are extremely volatile and may be affected by external factors such as financial, regulatory or political events. Trading on margin increases the financial risks.
Before deciding to trade in financial instrument or cryptocurrencies you should be fully informed of the risks and costs associated with trading the financial markets, carefully consider your investment objectives, level of experience, and risk appetite, and seek professional advice where needed.
Fusion Media would like to remind you that the data contained in this website is not necessarily real-time nor accurate. The data and prices on the website are not necessarily provided by any market or exchange, but may be provided by market makers, and so prices may not be accurate and may differ from the actual price at any given market, meaning prices are indicative and not appropriate for trading purposes. Fusion Media and any provider of the data contained in this website will not accept liability for any loss or damage as a result of your trading, or your reliance on the information contained within this website.
It is prohibited to use, store, reproduce, display, modify, transmit or distribute the data contained in this website without the explicit prior written permission of Fusion Media and/or the data provider. All intellectual property rights are reserved by the providers and/or the exchange providing the data contained in this website.
Fusion Media may be compensated by the advertisers that appear on the website, based on your interaction with the advertisements or advertisers.
© 2007-2024 - Fusion Media Limited. All Rights Reserved.