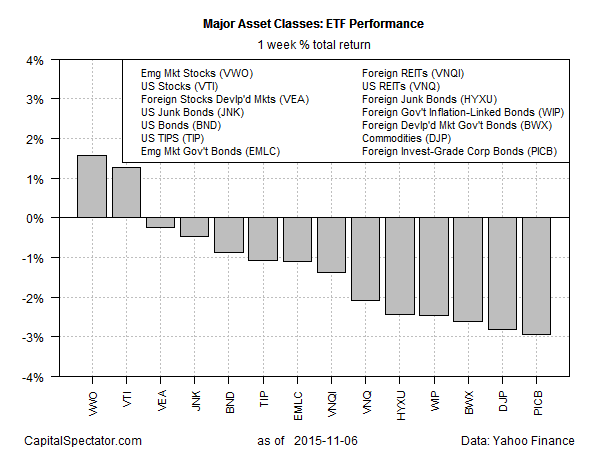
Equities in emerging markets took the lead last week, delivering the strongest gain among the major asset classes via a set of proxy ETFs. Vanguard Emerging Markets (N:VWO) popped 1.6% for the week through Nov. 6, edging out the number-two performer: US equities based on Vanguard Total US Stock Market (N:VTI), which climbed 1.2%.
Last week’s leadership role in emerging markets may inspire bullish expectations for this long-battered corner of the global stock market. But on closer inspection there’s still reason to wonder if VWO’s revival for the week just passed is the genuine article. Note that while these stocks had the strongest return last week, the price pop reversed course in the last two trading days.

The news on Friday that the US economy added a bigger-than-expected increase in payrolls in October weighed heavily on emerging market equities. Why? The surge in jobs creation last month substantially increased the odds that the Fed will start raising interest rates next month, which in turn boosted expectations that the recent strength in the dollar will roll on. The bullish trend for the greenback is a risk factor from the perspective of US-dollar-based investors considering emerging market assets. As The Wall Street Journal noted on Friday:
A stronger dollar is typically associated with lower prices for oil, metals and other commodities, a trend that tends to hurt emerging-market nations that depend on resources-related industries for employment and growth.
It doesn’t help the case for emerging market stocks to see VWO’s price momentum still dispensing bearish signals. For instance, the ETF’s 50-day moving average remains well below its 200-day equivalent and its rolling one-year return has been consistently negative since the summer.
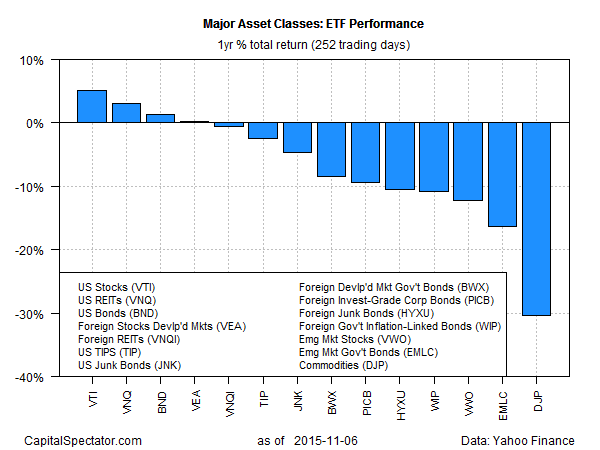
Turning to the trailing one-year track record (252 trading days), US stocks (Vanguard Total Stock Market (N:VTI)), US real estate investment trusts (Vanguard REIT (N:VNQ)), and US bonds (Vanguard Total Bond Market (N:BND)) are firmly in the lead through Nov. 6. Meanwhile, the big loser over the past year remains broadly defined commodities (iPath Bloomberg Commodity Total Return Exp 12 June 2036 (N:DJP)), which is deep in the red by more than 30%. Next in line for the red-ink brigade: emerging market bonds (Market Vectors JP Morgan EM Local Currency Bond (N:EMLC)) and emerging market stocks (VWO), which are down by 16.4% and 12.3%, respectively.

In other words, it’s still premature to argue that a sustained rebound is underway for emerging-market assets when measured in US dollar terms. There’s probably a value play rumbling around here, but for the moment the odds are still low that we’ll see quick payoff.
