Underneath Yellowstone National Park lies a dormant supervolcano.
Based on evidence of past eruptions, it’s capable of burying Wyoming, Montana, Idaho, and Colorado under several feet of volcanic ash.
And there are indications that the caldera, the chamber of molten rock, may be expanding – a disturbing sign under the surface of the seemingly placid wilderness.
Interestingly, it reminds me a lot of the S&P 500, which has continued to grind higher despite disturbing problems beneath the surface.
That’s why the big picture is always helpful, especially when dealing with diversified portfolios made up of various asset classes. A macro perspective can help us identify significant risks before they become mainstream news headlines.
With that in mind, let’s run through three key developments that you need to know about right now.
The China Syndrome
In case you haven’t noticed, industrial metal prices have been in free fall this year.
Part of the reason is that Chinese demand has dropped just as production capacity is hitting its stride. The spot price for iron ore, for example, is plumbing levels not seen since 2009. And rebar futures prices on the Shanghai Futures Exchange have dropped to a record low.
In reality, the problem is bigger than just industrial metals. China’s economy could be aptly described as a slow-motion train wreck right now, and building a few more uninhabited “ghost cities” won’t rectify the problem.
At the end of March, I identified six companies acutely exposed to a disaster in China. Let’s take a look at how they’ve performed:
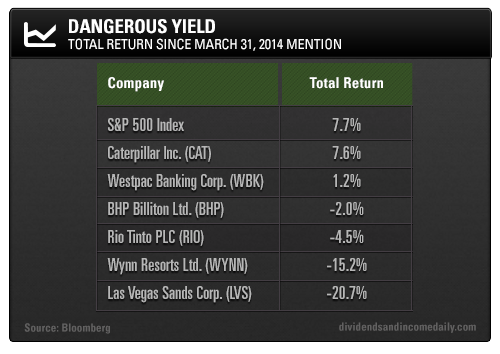
As you can see, all of these stocks have underperformed the S&P 500 since my mention.
However, my prognostications won’t truly be proven correct until China and Japan go to war.
Interestingly, the majority of the Chinese may actually expect this outcome. According to a recent poll, 53% of Chinese respondents and 29% of Japanese respondents expect war to break out between the two countries by the year 2020.
If war were to break out, one of Japan’s primary weaknesses would be its currency – even though yen depreciation is still being viewed as beneficial.
Currency Volatility Returns
In fact, currency volatility is generally on the rise after a summer slumber.
The U.S. Dollar Index is on track to post its ninth consecutive week of gains, and euro weakness has been a primary driver. Last week, the European Central Bank (ECB) announced plans to buy private-sector assets totaling hundreds of billions of euros. These purchases would be tantamount to quantitative easing, and the markets sent the euro reeling in response (which is actually what the ECB wants).
Meanwhile, the United Kingdom is experiencing its own currency problems, but for a very different reason. The prospect of Scottish independence has routed pound sterling and implied volatility has spiked.
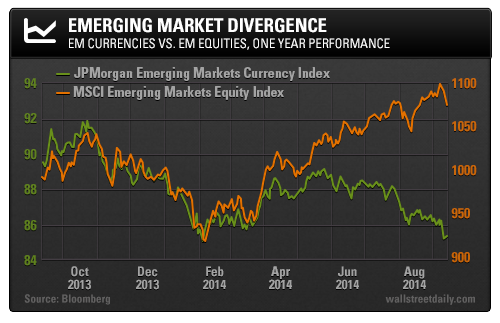
Emerging market currencies are also coming under pressure. One way to take on risk in the foreign exchange market is to buy high-yielding emerging market currencies (South African rand, Turkish lira, Polish zloty) and fund the purchase with low-yielding currencies (U.S. dollar, euro, Japanese yen).
Lately, though, these so-called carry trades have been unraveling. The chart below shows the divergence between the JPMorgan Emerging Markets Currency Index and the iShares MSCI Emerging Markets (ARCA:EEM) (emerging equities):
And like the foreign exchange market, the credit market tends to lead equities and can be a harbinger of doom.
Credit Spreads Widening
Perhaps you’ve noticed that high-yield bonds haven’t been performing quite as well recently. Since June 25, the iShares iBoxx High Yield Corporate Bond ETF (ARCA:HYG) has lost around 2.8%.
Widening credit spreads indicate declining risk appetite in the bond market. The chart below shows the relationship between the S&P 500 and the BofA Merrill Lynch High Yield Master II Index:
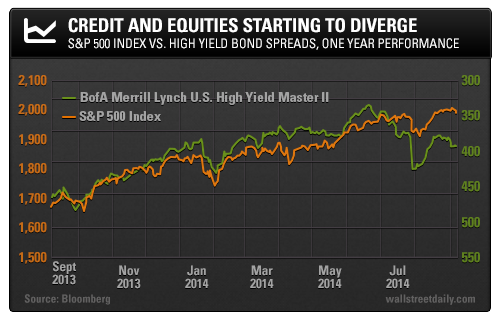
This divergence is occurring at a time when bond investors are turning to leverage in low-yield desperation, which will inevitably end in tears.
After all, leverage is not the answer to meet a 10% return hurdle. Instead, avoiding vulnerable assets before they underperform and patiently identifying opportunities as they’re presented is the ideal course of action.
Bottom line: The financial markets are awakening. Volatility is picking up in various global markets. The caldera under risk assets is churning.
This is a beautiful development that will create new opportunities. However, it’s also a situation for which few are prepared.
Safe investing,
Alan Gula, CFA