Get 40% Off
⚠ Earnings Alert! Which stocks are poised to surge?
See the stocks on our ProPicks radar. These strategies gained 19.7% year-to-date.
Unlock full list

4 Key Charts For Fed Day

Published 07/27/2016, 08:52 AM
Updated 07/09/2023, 06:31 AM

The 1994 case demonstrates the longer stocks go sideways, the bigger the move we can expect after a successful breakout. However, even under the successful breakout scenario, a retest of prior resistance may be in the cards, which is exactly what happened in early 1995. In 2016, the Dow Jones Industrial Average (below) may be in retest mode.
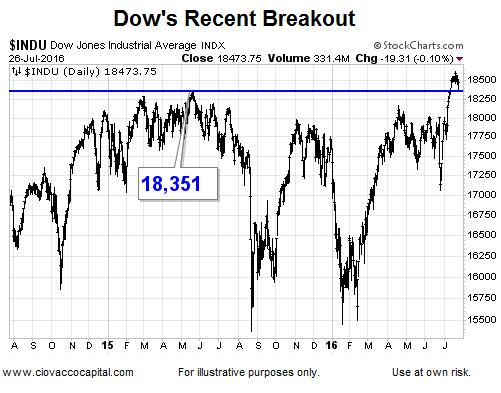
Dow Recent Breakout: Daily Chart

Reflation Trade

Given the high levels of global debt, the lesser of the evils alternative typically is to try to inflate it away. The chart below, showing the performance of materials stocks (via Materials Select Sector SPDR (NYSE:XLB)) relative to Treasuries (via iShares 20+ Year Treasury Bond (NYSE:TLT)), is one way to monitor the battle between inflation and lingering concerns about deflation.
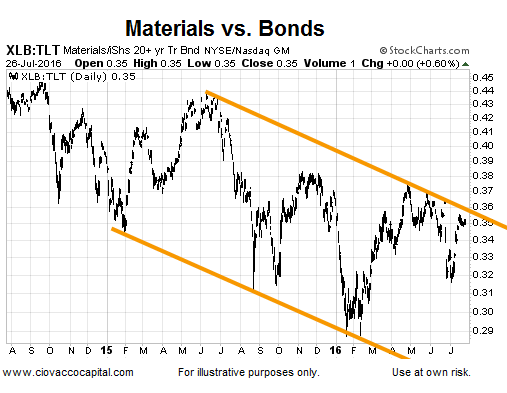
Materials Vs Bond

Like the XLB/TLT ratio above, the ratio of energy stocks (via Energy Select Sector SPDR (NYSE:XLE)) to Treasuries (TLT) also has some work to do. With a Fed statement coming Wednesday and one from the Bank of Japan before the end of the week, these ratios should provide some insight into the market’s reaction.
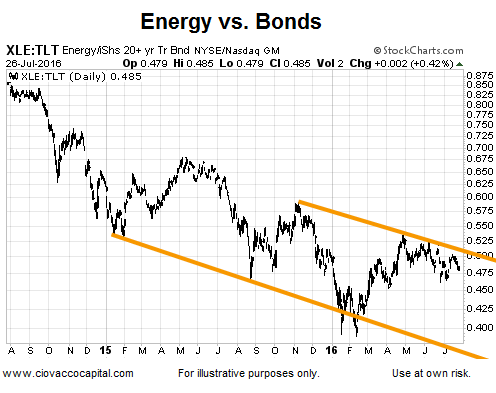
Energy Vs Bonds

Stocks vs. Bonds

The S&P 500 (via SPDR S&P 500 (NYSE:SPY)) has not yet broken out relative to long-term Treasuries, but has made some progress relative to intermediate-term Treasuries (via iShares 7-10 Year Treasury Bond (NYSE:IEF)). If the SPY/IEF breakout below holds, it will improve the odds of the S&P 500’s recent push above 2,134 holding.
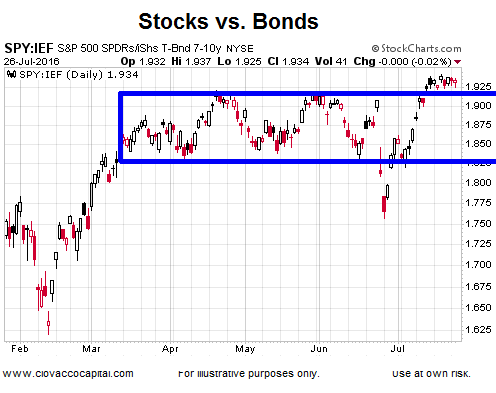
Stocks vs. Bonds

Latest comments

Risk Disclosure: Trading in financial instruments and/or cryptocurrencies involves high risks including the risk of losing some, or all, of your investment amount, and may not be suitable for all investors. Prices of cryptocurrencies are extremely volatile and may be affected by external factors such as financial, regulatory or political events. Trading on margin increases the financial risks.
Before deciding to trade in financial instrument or cryptocurrencies you should be fully informed of the risks and costs associated with trading the financial markets, carefully consider your investment objectives, level of experience, and risk appetite, and seek professional advice where needed.
Fusion Media would like to remind you that the data contained in this website is not necessarily real-time nor accurate. The data and prices on the website are not necessarily provided by any market or exchange, but may be provided by market makers, and so prices may not be accurate and may differ from the actual price at any given market, meaning prices are indicative and not appropriate for trading purposes. Fusion Media and any provider of the data contained in this website will not accept liability for any loss or damage as a result of your trading, or your reliance on the information contained within this website.
It is prohibited to use, store, reproduce, display, modify, transmit or distribute the data contained in this website without the explicit prior written permission of Fusion Media and/or the data provider. All intellectual property rights are reserved by the providers and/or the exchange providing the data contained in this website.
Fusion Media may be compensated by the advertisers that appear on the website, based on your interaction with the advertisements or advertisers.
© 2007-2024 - Fusion Media Limited. All Rights Reserved.