Our Most Attractive and Most Dangerous stocks for June were made available to the public at midnight on Wednesday. May saw some strong performances from our picks. Most Attractive small-cap stock CTC Media (NASDAQ:CTCM) gained 19%, and large-cap SanDisk Corporation (NASDAQ:SNDK) rose 12%.
Our Most Dangerous stocks (+0.8%) rose by less than the S&P 500 (+2.1%) and outperformed as a short portfolio. By far the biggest decliner in the portfolio was PowerSecure International (NYSE:POWR), which declined 62% in May after a poor Q1 results. POWR shares crashed two days after our report was made available to subscribers, but before it was released for public purchase.
These successes underscore the benefit of our diligence. Being a true value investor is an increasingly difficult, if not impossible, task. By scrupulously analyzing every word in annual reports, our research protects investors’ portfolios and allows our clients to execute value investing strategies with more confidence and integrity.
11 new stocks make our Most Attractive list and 12 new stocks fall onto the Most Dangerous list this month.
Our Most Attractive stocks have high and rising return on invested capital (ROIC) and low price to economic book value ratios. Most Dangerous stocks have misleading earnings and long growth appreciation periods implied in their market valuations.
Most Attractive Stock Feature For June: Syntel, Inc. (SYNT: ~$82/share)
Syntel Inc. (NASDAQ:SYNT) is one of the additions to our Most Attractive stocks for June. SYNT is down 10% this year, but unlike many of the other beat up tech stocks, it has positive and growing economic earnings.
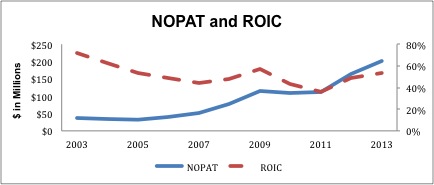
SYNT’s long track record of growth and profitability is hard to match. Over the past ten years, SYNT has grown after-tax profit (NOPAT) by 20% compounded annually while maintaining an average ROIC of 57%. Figure 1 gives more detail.

Sources: New Constructs, LLC and company filings
Sometimes, such a high ROIC can be a warning sign for future regression to the mean, but a look at SYNT’s competitors shows such a fear is unwarranted in this case. Accenture (NYSE:ACN) earns a 60% ROIC and Cognizant Technology Solutions (NASDAQ:CTSH) earns a 40% ROIC. IT consulting and outsourcing is a low capital intensity business, so high ROICs are more the norm.
One area of concern is SYNT’s high level of customer concentration. 10 customers make up 77% of its revenue, and the largest, American Express (NYSE:AXP), accounts for 25% of total revenue. On the positive side, SYNT has shown itself to be adept at retaining customers. 97% of SYNT’s revenue in 2013 came from repeat clients.
SYNT’s most recent Form 10-Q also contains some encouraging results. SYNT grew revenues in its ‘Retail, Logistics, and Telecom’ and ‘Healthcare and Life Sciences’ segments by 79% and 30% year-over-year, respectively. Strong growth in these segments shows that the company is making some headway in diversifying its businesses aside from its largest segment, ‘Banking and Financial Services’.
One would expect a growing, highly profitable company to also command a premium valuation, but the market has surprisingly low expectations for SYNT. Its current valuation of ~$82/share gives it a price to economic book value ratio of 1.2, which implies that the company will only grow NOPAT by 20% for the remainder of its corporate life.
Even with a modest expectation of just 8% NOPAT growth for the next 10 years, SYNT has a fair value of ~$105/share. Given its track record of profit growth, SYNT looks like a good bet to meet or even exceed that expectation.
Most Dangerous Stock Feature For June: LoJack Corporation (LOJN: $5.50/share)
LoJack Corporation (NASDAQ:LOJN) is one of the additions to the Most Dangerous list this month. The stock has become significantly more dangerous over the last month due to its 16% increase in valuation.
LOJN has fallen far since its peak in the mid-2000’s when it neared $30/share. 2014 has seen a mini-resurgence for the stock however, as LOJN has soared 50% on earnings beats and bullish analyst write-ups. Digging deeper into the numbers shows that LOJN’s earnings are misleading and its valuation implies unrealistic growth expectations.
LOJN reported $3.2 million in GAAP net income for 2013, but the vast majority of that income came from non-operating items. Primarily, LOJN benefited from:
- $1 million in “Other Income”, primarily attributable to a gain on the sale of the company’s shares in Absolute Software.
- A $0.6 million benefit due to a legal settlement.
- A $0.6 million reduction to the allowance for doubtful accounts.
- A $2.6 million non-operating tax adjustment.
All these items could be found either on the income statement or the cash flow statement, so there’s really no excuse for investors not to identify these items and make the necessary adjustments. Once all the non-operating items are removed, we can see that LOJN’s true NOPAT was only $0.15 million for 2013.
By looking at NOPAT rather than accounting earnings, we can see just how much growth is baked into LOJN’s valuation. In order to justify ~$5.50/share, LOJN would need to grow NOPAT by 40% compounded annually for 12 years.
Given LOJN’s recent track record of declining margins and profits, the growth implied by its stock price seems unrealistic. Management’s decision to shift to pre-installed units on cars has helped stabilize revenue, but it has hurt margins. Meanwhile, LOJN’s goal of providing a full “connected car” experience is still in its early stages, and the company faces significant competition on that front from large companies such as AT&T (T).
I’ve written before about why performance chasing in the stock market is a bad idea. LOJN has been a high flyer in 2014, while SYNT has been a dud. However, looking at the fundamentals, rather than the price movement, shows that SYNT is primed to reward investors while LOJN carries significant risk.
Sam McBride contributed to this report.
Disclosure: David Trainer and Sam McBride receive no compensation to write about any specific stock, sector, or theme.
