
Equities
Chart 1: Managers exposure towards equities is now “all-in” mentality!
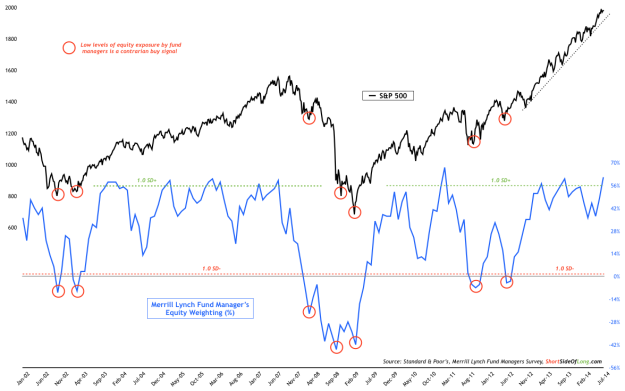
- This months Merrill Lynch Fund Manager Survey equity exposure came in at 61% overweight, relative to last months reading of 48%. Managers have pushed their exposure towards global equities to second highest levels in surveys history. Last time we saw exposure this extreme was in February 2011, just as the Euro Crisis was starting. As we approach the time of the year usually considered seasonally weak and the Federal Reserve finishes up the taper, equities look rather vulnerable. If you believe in surveys contrarian signals, today is probably not the best time to be buying equities… to say the least!
Chart 2: Bullish sentiment isn’t euphoric, but complacency dominates
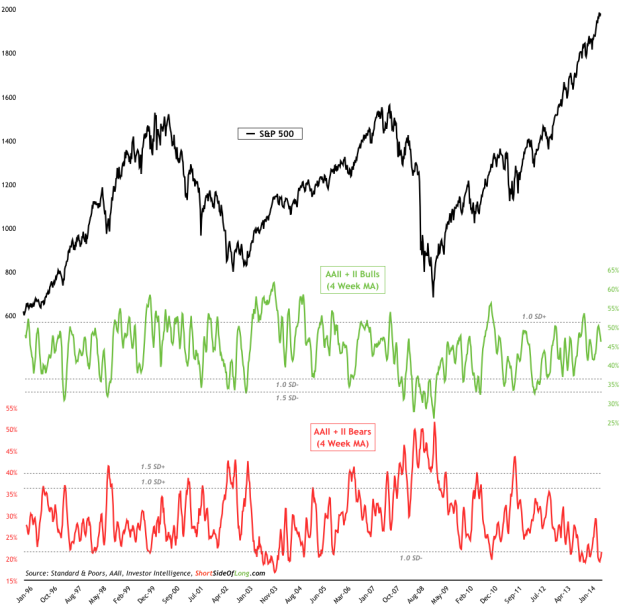
- Summarising various the equity sentiment survey readings for the month, we can observe in the chart above that bullish sentiment has pulled back from last months readings. In general, bullish sentiment hasn’t been all that extreme on either end, but the major story in the recent months has been the lack of volatility and total complacency, which has therefore lead to complete lack of bears. Other sentiment surveys such as Consensus Inc, Market Vane and NAAIM actually show a much higher level of bullishness that usually link to a possibility of a price pullback.
Chart 3: July is shaping up to be 1st major monthly outflow in two years
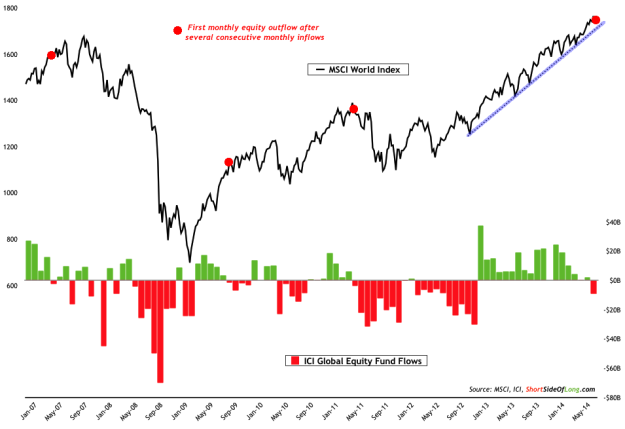
- This month’s fund flows report by ICI showed global equity funds showed a first estimated monthly outflows of -$9.4 billion, after so many consecutive monthly inflows. The chart above contains red dots, which show time periods in the last seven year history where retail investors pulled money out of mutual funds for the first time, after several monthly consecutive inflows. First occasion was in early 2007, just as the market was near its peak. Second occasion was into late 2009, just after a powerful rebound. Markets stalled over the coming months. Third occasion was into middle of 2011 just as the market was near its peak. And finally, here we are today…
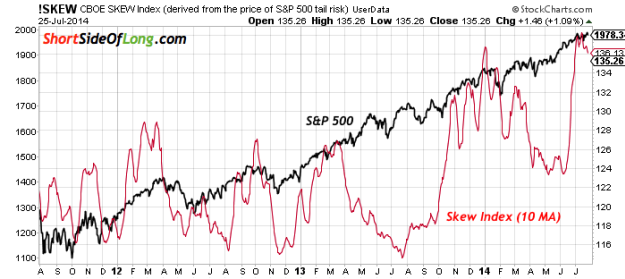
- Summarising this month’s options & volatility conditions continue to remain in a very complacent zone. Obviously, this isn’t a major worry for the time being, until volatility starts picking up and investors start getting worried. A market trader with a keen eye should have already noticed a pick up in the VIX, as it diverges with large cap indices such as S&P 500. Furthermore, while not perfect, another indicator is also flashing warning signals. Skew Index, seen in the chart above, is used to predict a possible pick up in volatility. The 10 day moving average of the indicator has remained above 135 for several weeks now, which according to CBOE indicates almost 12% chance of a 2 standard deviation move.
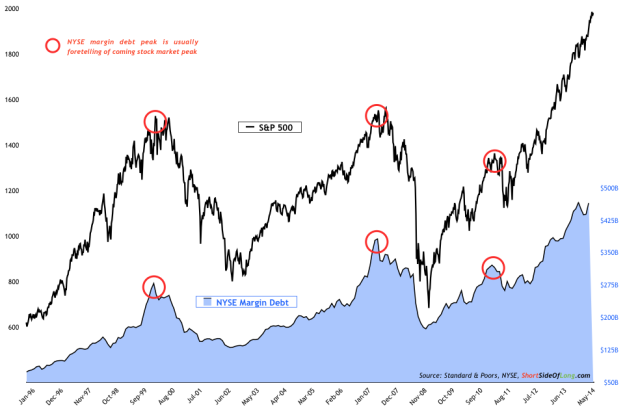
- According to NYSE’s latest monthly report, investor margin debt increased by $25.8 billion to $464.31 billion. While we did see two consecutive monthly declines in leverage, margin debt has now recovered in a very robust fashion. Without a doubt, the extremes still remain in place and warn that investors are overly exposed to equities, however there is yet no proper sign of de-leverging (as seen by red circles in Chart 5).
Cash & Bonds
Chart 6 & 7: Retail investors push cash exposure towards lower levels!
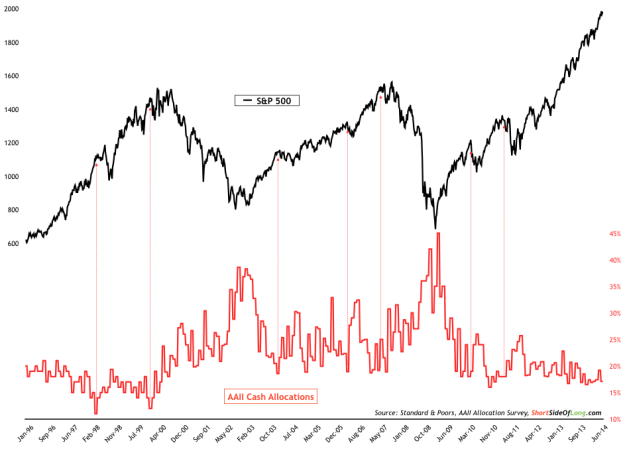
- Recent monthly AAII Asset Allocation Survey cash exposure fell towards 17.1%, compared to last months reading of 19.2%. As stated last month, usually low cash levels have almost always signalled intermediate stock market peaks, however the current rally has earned a nickname of “teflon market” and therefore no extremes have yet impacted the price of the uptrend. Moving along to other cash indicators, this months Merrill Lynch Fund Manager Survey cash exposure remained at the same level of 4.5%. With no change, readers should refer to last months report to view the chart again.
Chart 8: Managers further pressed their underweight bond exposure…
- This months Merrill Lynch Fund Manager Survey bond exposure came in at 64% underweight, relative to last months reading of 62% underweight. The bond market continues to rally and yet global fund managers exposure towards this particular asset keep falling. Merrill Lynch explains this by stating that a large majority of managers believe central banks are now anticipate a rise in short term interest rates. Moreover, investors should take notice of the fact that the exposure spread between long equities and short bonds is at one of the highest levels in surveys history.
Chart 9: Fund inflows continue with corporate bonds near record highs
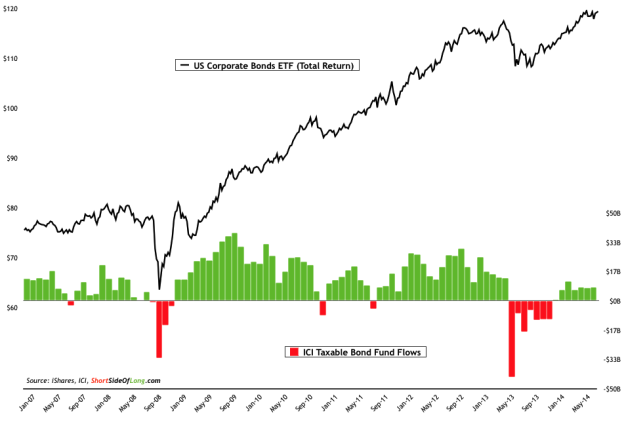
- This month’s fund flows report by ICI showed taxable bond funds had estimated inflows of $8.17 billion in the month of July. This compares to a total estimated inflows of $9.7 billion in the month of June. Abundance of recent commentary has focused on the superb performance corporate grade and junk grade bonds have achieved over the last several quarters, and the chart above shows the ongoing capital flowing towards corporate bonds.
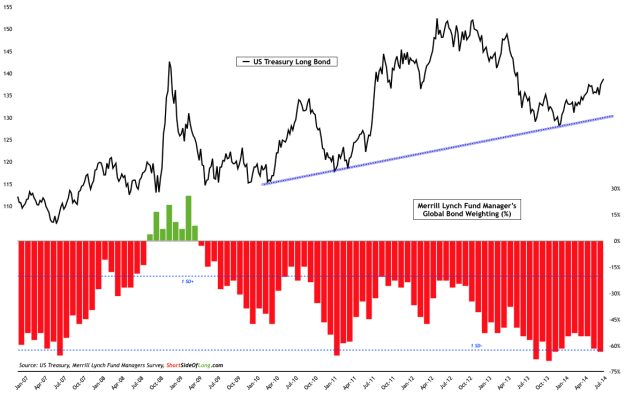
Chart 10: Despite this years powerful rally, funds aren’t positioned long!
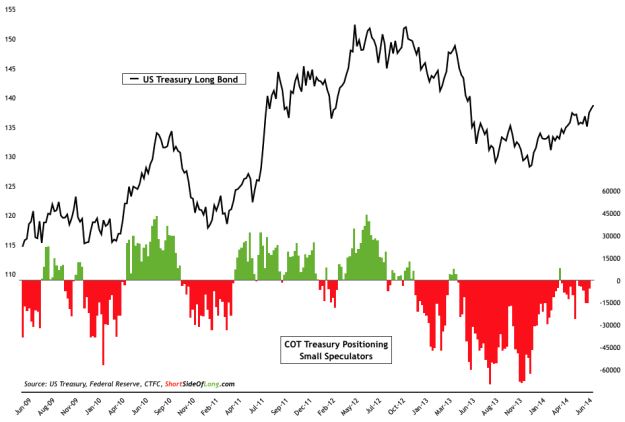
-
This month’s commitment of traders reports shows that small speculators remain rather neutral in the Treasury Bond market. If we refer to the chart above, we can see that bearish bets really stood out in August 2013 and again in December 2013, both marking intermediate lows for the Long Bond. However, despite a very powerful recovery rally this year, speculators have not yet turned net long. This is quite puzzling in a similar way that is also seen in the Merrill Lynch FMS, where exposure to bonds has been falling despite rising prices.
Commodities
Chart 11: Fund manager exposure towards commodities has improved
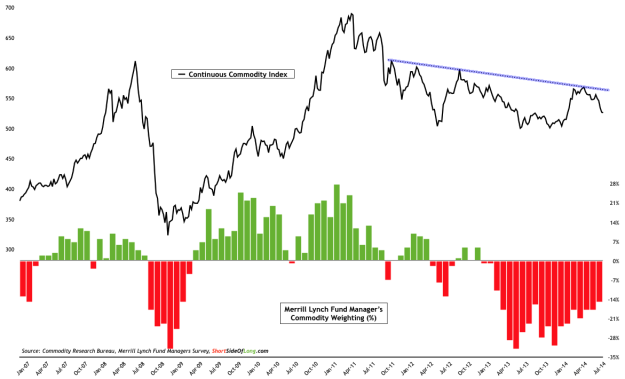
- This month's Merrill Lynch Fund Manager Survey commodity exposure came in at 15% underweight, relative to last months reading of 18% underweight. Commodities have undergone a strong rally in the first half of the year, as they outperformed equities and bonds. Therefore, it is no surprise that managers have been chasing the price by improving exposure towards this asset. Continuous Commodity Index has now almost completely reversed the rally, so I would anticipate a deterioration in commodity exposure from global funds in coming months. Furthermore, from a pure technical perspective, commodity index in Chart 11 failed to break out and post a higher high, so at this point we officially still remain in a downtrend.
Chart 12: Funds are getting out of Agricultural commodities in a hurry!
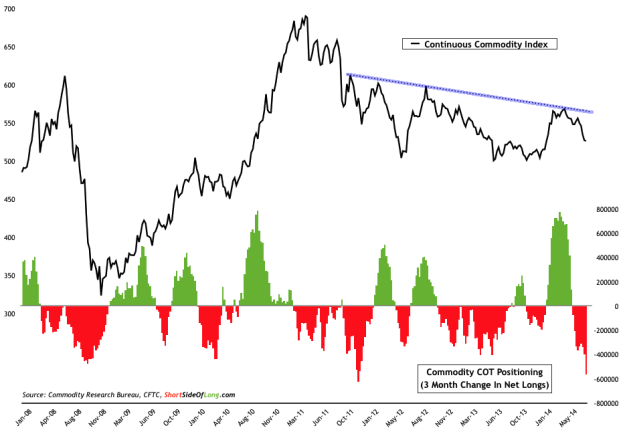
- This month’s commitment of traders reports showed that hedge funds and other speculators continue to cut their net long exposure towards commodities. Custom COT total net long contracts (refer to the chart in last months report) stand at 393,000, compared to last months reading of 599,000 net long contracts. If we observe Chart 12, we can clearly see that the 3 month rate of change in net long contracts is one of the lowest in the last six years. In plain English, hedge funds are cutting bullish bets on commodities at an extremely fast rate and the main culprit for this has been the Agricultural sector.
Chart 13: Agricultural sentiment surveys have completely collapsed!!!
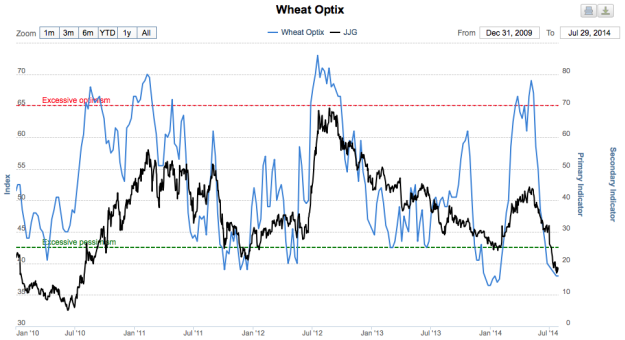
-
I have been focusing on the extremely disliked and disowned grains sector on the blog in recent posts. As it currently stands, futures positioning as well as sentiment surveys are pointing to possibility that panic selling is very close to ending. Corn, Wheat and Soybeans are extremely oversold and over the last 3 months, have declined by 26.9%, 28.3% and 17.4% respectively. Even more importantly, many of these agricultural commodities are having some of the worst two year returns in decades. Corn is down 54% over the last 24 months, while Wheat has suffered a 42% loss within the same time period. At current depressed prices, it is hard to see farmers rushing out to build up global inventory levels in coming years. Therefore, keep a close eye on the price, as we could be very close to a bottom.
Currencies & PMs
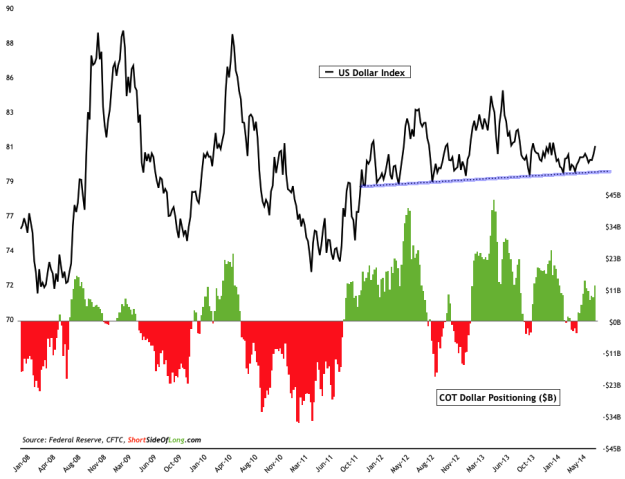
Chart 14: USD has held support & might be ready for another leg up…
-
This month’s commitment of traders reports have shown a slight increase in positioning. This months custom COT total stands at $12.8 billion of net long contracts, compared to last months level of $10.9 billion of net long contracts. Majority of the bullish bets are coming from the Euro Dollar exchange rate pair, where speculators see further weakness for the European currency. According to the chart above, sentiment isn’t anywhere near extremes just yet, as we have Dollar shorts held against the Pound, Loonie, Aussie and Kiwi. As always, higher prices in the US Dollar Index will entice more speculators and trend followers to chase prices higher.
Chart 15: Japanese Yen is about to make a large move in either direction
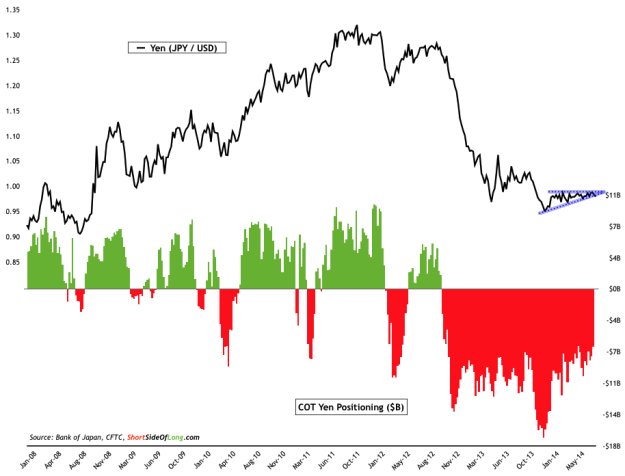
- Over the last couple of months, Japanese Yen has been identified on this blog as a very decent opportunity, more so for traders then longer term investors. The volatility on the currency is at a multi-decade lows, and periods of low volatility are usually preceded by periods of high volatility. The technical price pattern resembles a pressure cooker right now and something has to give very soon. Disclosure: Short Side of Long newsletter subscribes would already know that I have been expecting the Yen to break out on the upside, however as of Friday I have been stopped out of the trade for a very small -0.1% loss (I tightened my stop loss in accordance with the triangle pattern). From a short term trading perspective, I am now ready to go either long or short as soon a first real hint is given.
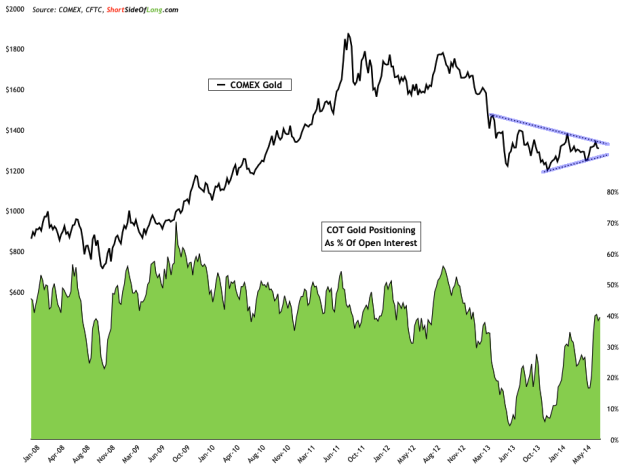
Chart 16: Caution is advised as funds pile back into Precious Metals…
-
This month’s commitment of traders reports have shown substantial increase in Precious Metals net long positioning yet again. Gold COT stands 161,200 net long contracts (39.5% of OI) in the month of July, compared to last months level of 131,600 (33.5% of OI). In the Silver market, COT stands 58,300 net long contracts (35.9% of OI), compared to last months level of 42,900 (27.1% of OI). As we can clearly see in Chart 16, Gold is consolidating in a sideways pattern right now. While bulls have been piling into the sector and busy pushing prices higher, they have failed to push the price into higher highs pattern known as an uptrend. The current level of bullish sentiment is extremely high for a market that remains in a price downtrend, so I would advise caution right now. Obviously, I would change my mind on the current short term direction, if and when Gold was to break above $1,400 per ounce.