Risk aversion was the theme last week as S&P 500 tumbled -3.1% over the week and recorded the biggest fall since May 2012. DJIA also followed by losing -2.7%. Long term US treasury yields also extended recent decline. The slightly more dovish than expected FOMC minutes triggered a rebound in equities and pull back in dollar. But the impact lasted less than a day. The European Stoxx 600 index also posted the worst weekly fall since May 2102 on worry over the economic outlook. In the currency markets, yen was the biggest winner on risk aversion and falling yields and registered broad based gains last week. Dollar was the weakest one but it stabilized and picked up some strength towards the end of the week. Commodity currencies were generally pressured.
There were some central bank activities last week but none except the FOMC minutes triggered some brief reactions. The FOMC minutes for the September meeting unveiled little news about the central bank's monetary outlook. Policymakers, while acknowledging improving economic prospects, decided to keep the 'considerable time' language amidst concerns that the removal of which would lead to unexpected tightening financial conditions. Yet, the central bank emphasized that the 'considerable time' language would be changed if economic data are deemed favorable by policymakers. Immediate market reaction suggested that the minutes were interpreted as dovish. The US dollar declined while the euro and gold climbed higher. More in September Minutes: Members Argued About 'Considerable Time' Reference.
The Bank of Japan maintained the asset purchase program unchanged, keeping the pace of increasing base money at 60-70 trillion yen per year through purchases of government bonds and risky assets, in October. While retaining the view that the central bank's 2% inflation target would be achieved next year without further monetary easing, policymakers acknowledged that weak consumer spending has hurting output and business sentiment. The BOJ admitted that the effect of the sale tax hike on the economy was 'prolonged'. A member dissented the description on inflation expectations and suggested the inflation expectations have been on an uptrend from a somewhat longer-term perspective. More in BOJ Maintained Asset Purchase Program While Tweaking Output Assessment
The RBA left the cash rate unchanged at 2.5% and maintained the neutral stance in October. Despite signs of improvement in the domestic economy, the central bank retained the forward guidance that 'on present indications, the most prudent course is likely to be a period of stability in interest rates'. The RBA appeared to have toned down the stance on strong Australian dollar following the recent decline. Yet, it continued to warn that, at the current level, the Australian dollar has offered less assistance than would normally be expected in achieving balanced growth in the economy'. More in RBA Left Cash Rate Unchanged For A Year, Maintaining Neutral Stance.
BoE left interest rates unchanged at 0.50% and held the asset purchase target at GBP 375b as widely expected. Only a brief statement was released and focus will turn to meeting minutes to be published on October 22.
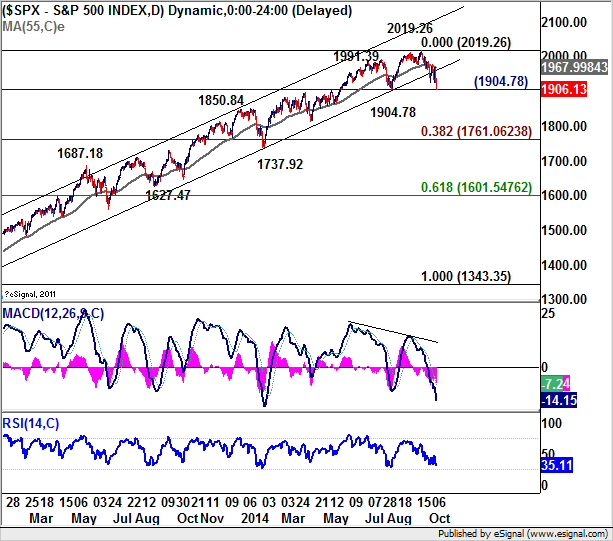
Technically, S&P 500 has highly likely topped out in medium term at 2019.26 already. This is supported by bearish divergence in daily MACD, rejection from 55 days EMA and decisive break of the the medium term channel support. Closed at 1906.13, the focus is immediately at 1904.78 support level this week. Sustained break there will confirm this bearish case and turn outlook bearish for deeper correction. We'd possibly see initial support only around 38.2% retracement 1343.35 to 2019.26 at 1761.06.
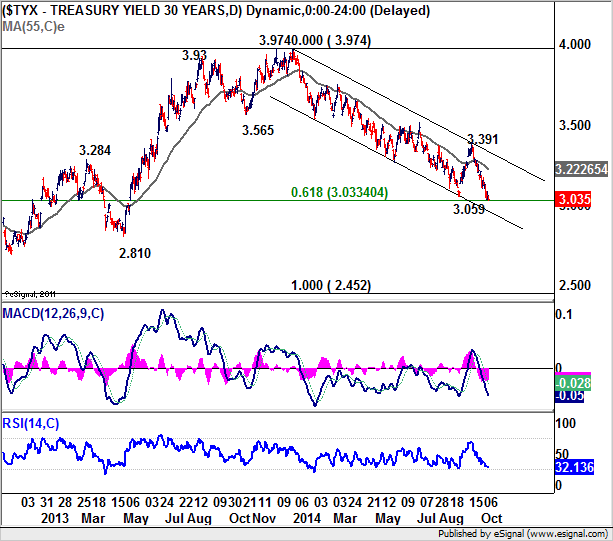
The TYX, 30-Year yield, break recent support at 3.059 and extended the whole down trend from 3.974. Immediately focus is on 61.8% retracement of 2.452 to 3.794 this week. Based on current momentum, such fibonacci level would likely be taken out easily. And, TYX should head for 2.810 support level next. Both the development in stocks and yields favor further decline in yen crosses in general.
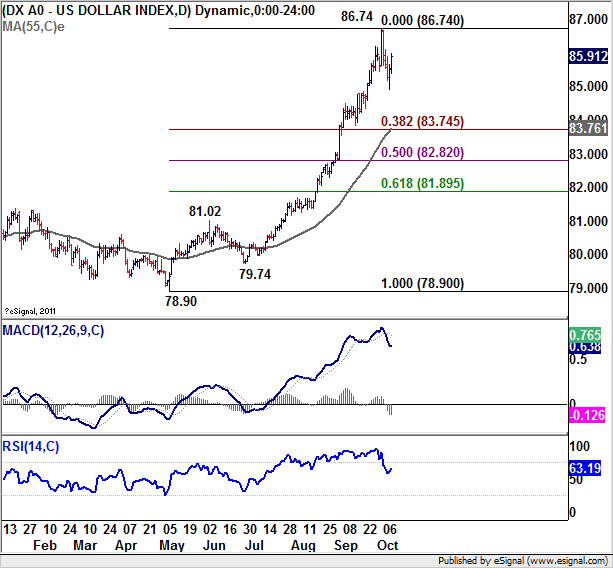
Dollar Index could have formed a short term bottom at 86.74 with daily MACD crossed below signal line. Near term outlook is turned neutral for some consolidations. We might see another round of pull back. But downside should be contained by 38.2% retracement of 78.90 to 86.74 at 83.74 and bring rise resumption. The long term up trend from 72.69 is expected to extend to 88.70/89.62 resistance zone later.
Regarding trading strategies, we stayed short in EUR/USD last week. The retreat in dollar gave us chance to enter GBP/USD short at a better price. We'll hold short in both EUR/USD and GBP/USD this week first. Nonetheless, the correction from respective short term bottom of 1.2500 and 1.5951 might extend with another rebound. This is inline with the view on dollar index above. Hence, we'll keep our shorts tight.
Based on the outlook in stocks and yields, we'll try to sell a yen cross this week. USD/JPY would be avoided as the greenback's rally might resume sooner than we expect. The candidates to consider are Euro, Sterling, Aussieand Loonie. Euro is mildly stronger than sterling as EUR/GBP could have bottomed at 0.7766 already. Meanwhile, EUR/AUD looks like resuming recent rise from 1.4586. Thus, we'll rule out selling EUR/JPY.
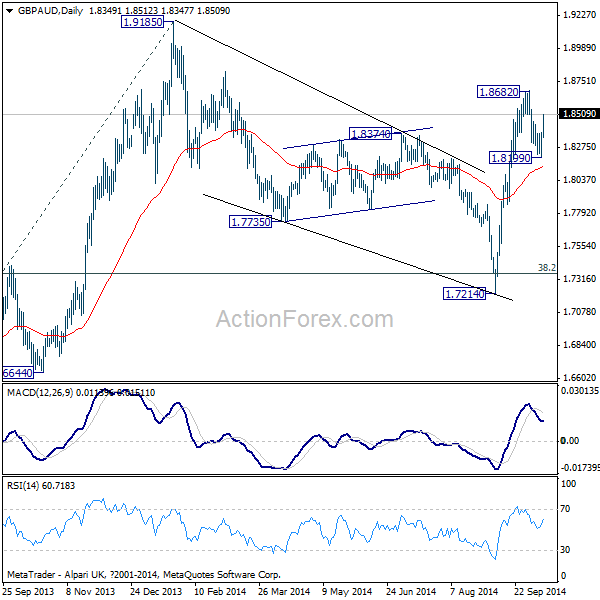
GBP/AUD staged a strong rebound on Friday and it looks like the pull back from 1.8682 has completed at 1.8199 already. Also, we're maintaining the bullish view that correction from 1.9185 is completed with three waves down to 1.7214. We'd expect a test on 1.8682 this week and break will target 1.9185. Hence, we'd prefer selling Aussie rather than Sterling.
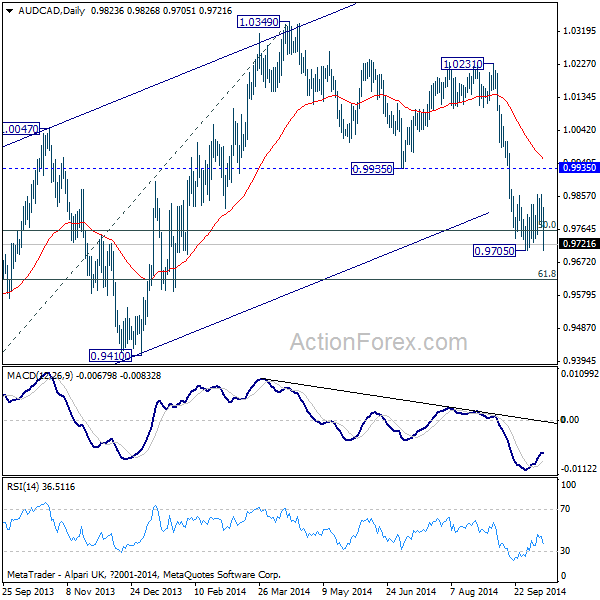
Meanwhile, AUD/CAD's consolidation from 0.9705 was limited well below 0.9935 support turned resistance, thus, maintained the bearish outlook. Friday's dip argues that recent fall is possibly resuming. Break of 0.9705 will target 61.8% retracement of 0.9169 to 1.0349 at 0.9620 and below. So, we'd also prefer selling Aussie rather than Loonie.
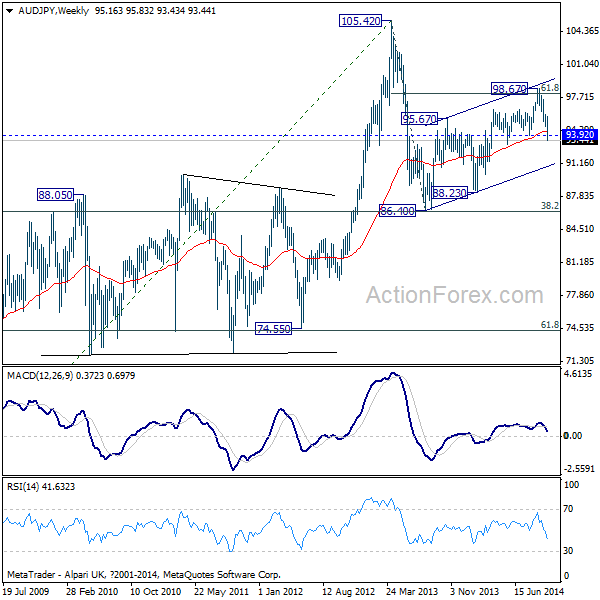
Finally, AUD/JPY's sharp decline last week took it through 93.92 structural support decisively. The development confirmed firstly that rise from 88.23 has finished at 98.67. Also, it should be noted that the corrective rise from 86.40 has possibly completed with three waves up to 98.67 too, after hitting 61.8% retracement of 105.42 to 86.40. Near term outlook in AUD/JPY is clearly bearish for a test on the lower channel support (now 90.7) first.
So to conclude, firstly, we'll stay short in EUR/USD with a tight stop at 1.2720. We'll hold short in GBP/USD, also with a tight stop at 1.6140. And, we'll sell AUD/JPY this week.
