
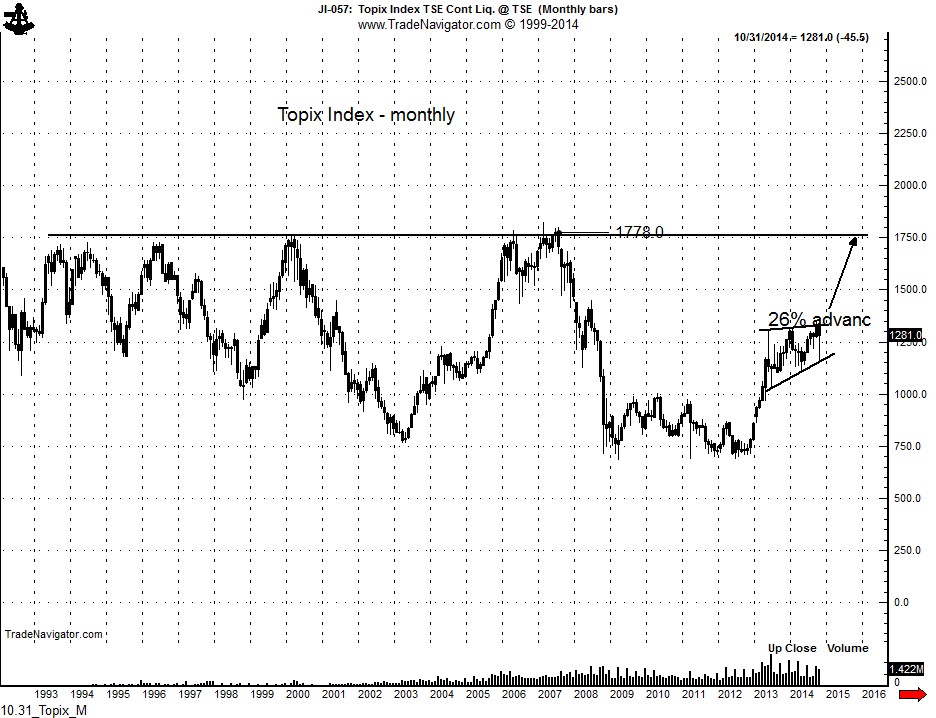
Benchmark Topix completing massive ascending triangle
Target is 1750 — a 26% gain from present level
The major news overnight has been the upward explosion of the Japanese stock market. There are some sound macro reasons why Japanese stocks must trade higher, but for now I will focus on the charts.
First, the monthly chart of the Topix. As shown below, the Japanese market remains depressed relative to other global stock markets. For nearly two years The Factor has been forecasting a move by the Topix to 1750 — a retest of the highs in 1993, 1994, 1996, 2006, and 2007. This price target represents a 26% advance from present levels.
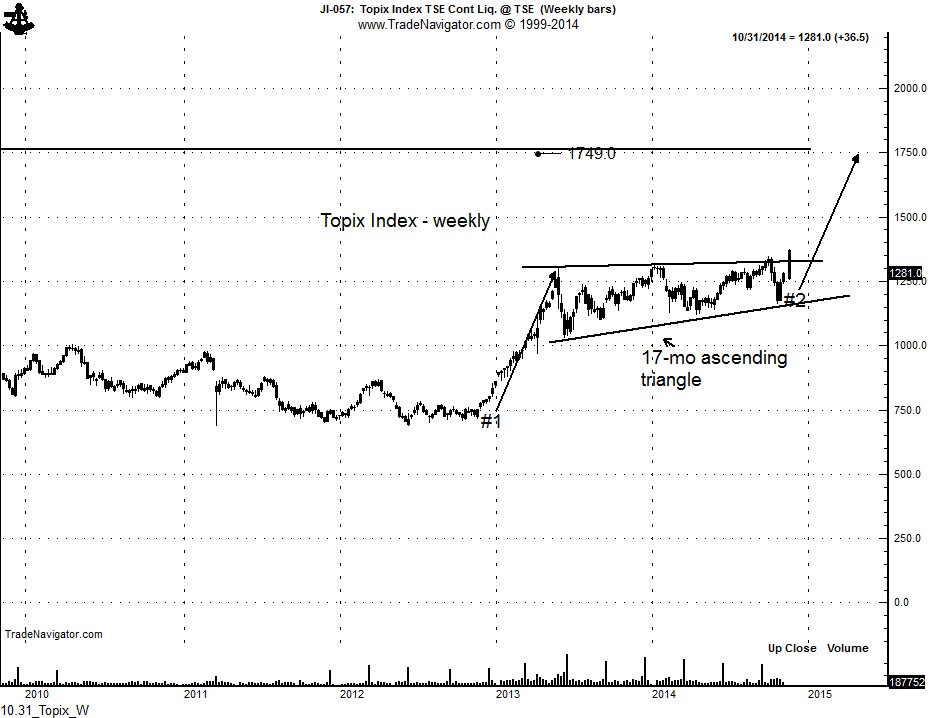
The weekly chart displays a possible completion (as of today) of a 17-month ascending triangle. Major continuation patterns often develop at the half-way mark of a trend. Thus, I am fully expecting that the current advance (#2) will duplicate the advance from the Nov 2012 low to the May 2013 high.
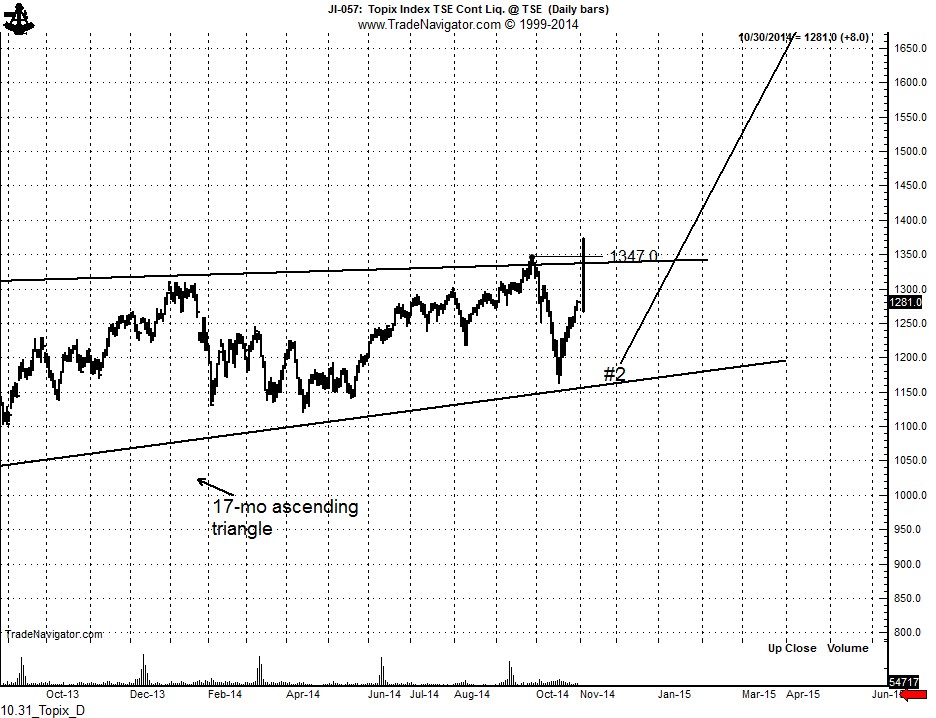
The daily Topix chart is a close-up of the present breakout. Support would be found at 1320 to 1350. However, if the present advance resembles the Nov 2012 to May 2013 advance, price breaks should be brief and well supported.
Note: This post represents the type of chart analysis produced on at least a weekly basis for members of the Factor subscription service. For more information, see the menu bar at the top of this blog site, or click here. In the near future, a limit may be placed on Factor membership.
The information in this blog post represents my own opinions and does not contain a recommendation for any particular security or investment. I or my affiliates may hold positions or other interests in securities mentioned in the Blog, please see my Disclaimer page for my full disclaimer.