Johnson & Johnson (NYSE:JNJ) is set to report FQ1 2014 earnings before the market opens on Tuesday, April 15th. Johnson & Johnson is one of the largest medical device, pharmaceutical, and packaged consumer goods companies in the world. Over the past year JNJ has beaten expectations from both Wall Street and the buy side 4 quarters in a row. This quarter Wall Street is expecting JNJ to keep expanding and report 3% year over year EPS growth as well as a 2.6% increase in yoy sales. Here’s what investors expect JNJ to report on Tuesday.
The information below is derived from data submitted to the Estimize.com platform by a set of Buy Side and Independent analyst contributors.
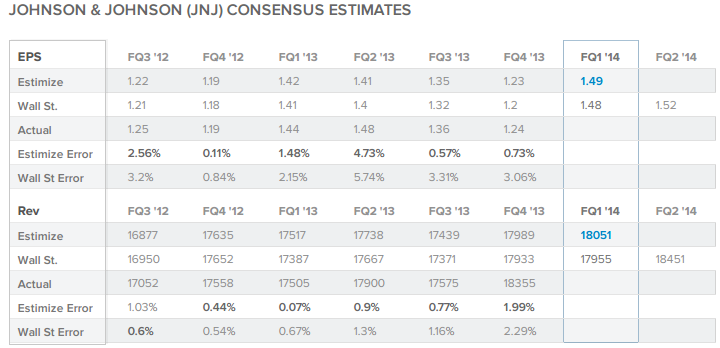
The current Wall Street consensus expectation is for Johnson & Johnson to report $1.48 EPS and $17.955B revenue while the current Estimize.com consensus from 22 Buy Side and Independent contributing analysts is $1.49 EPS and $18.051B in revenue. This quarter the buy-side as represented by the Estimize.com community is expecting Johnson & Johnson to beat the Wall Street consensus on both EPS and revenue by a small margin.
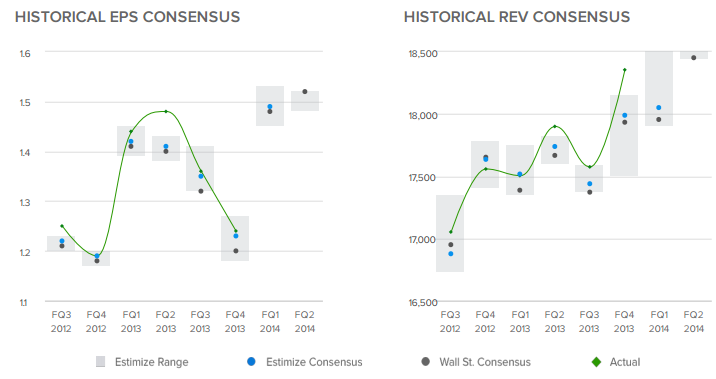
Over the past 6 quarters the consensus from Estimize.com has been more accurate than Wall Street in forecasting JNJ’s EPS every time and has been more accurate in forecasting revenue 5 times. By tapping into a wider range of contributors including hedge-fund analysts, asset managers, independent research shops, students, and non professional investors Estimize has created a data set that is more accurate than Wall Street up to 69.5% of the time, but more importantly it does a better job of representing the market’s actual expectations. It has been confirmed by Deutsche Bank Quant. Research and an independent academic study from Rice University that stock prices tend to react with a more strongly associated degree to the expectation benchmark from Estimize than from the Wall Street consensus.
The magnitude of the difference between the Wall Street and Estimize consensus numbers often identifies opportunities to take advantage of expectations that may not have been priced into the market. In this case we are seeing a small to moderate differential between the two groups’ EPS expectations.
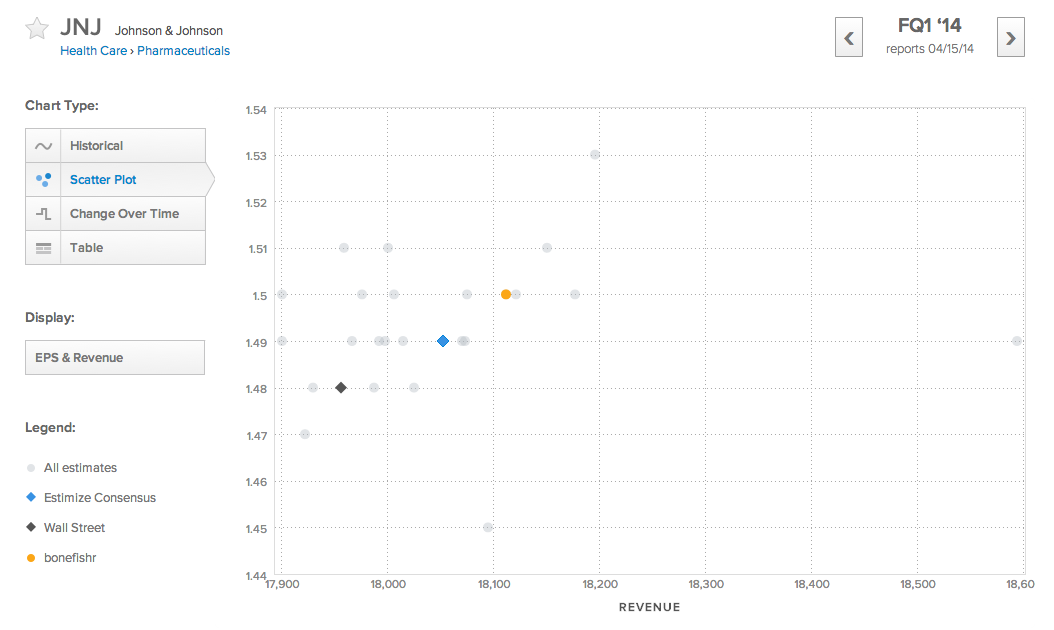
The distribution of estimates published by analysts on the Estimize.com platform range from $1.45 to $1.53 EPS and from $17.900B to $18.594B in revenues. This quarter we’re seeing a wider distribution of estimates on Johnson & Johnson, especially on revenue.
The size of the distribution of estimates relative to previous quarters often signals whether or not the market is confident that it has priced in the expected earnings already. A wider distribution of estimates signaling less agreement in the market, which could mean greater volatility post earnings.
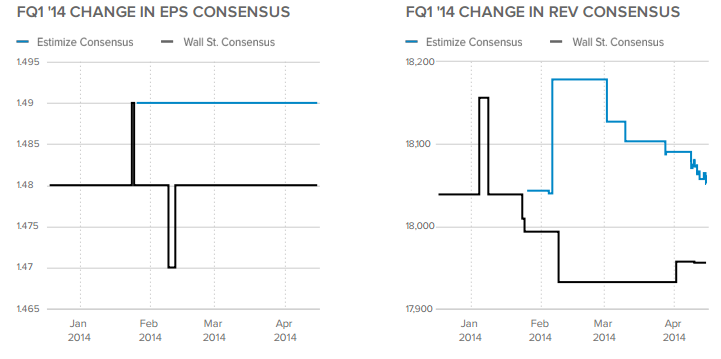
Over the past 4 months the Wall Street EPS consensus both started and ended the period at $1.48 while the Estimize consensus also remained flat at $1.49. Meanwhile the Wall Street revenue consensus declined from $18.039B to $17.955B while the Estimize forecast rose to a high of $18.179B before falling to $18.051B. Timeliness is correlated with accuracy and downward analyst revenue revisions at the end of the quarter are often a bearish indicator. Although the Estimize revenue consensus was falling going into the report, there is still a moderate differential between the two groups’ sales projections.
The analyst with the highest estimate confidence rating this quarter is bonefishr who projects $1.50 EPS and $18.112B in revenue. bonefishr is ranked 951st overall among over 4,000 contributing analysts. Over the past 2 years bonefishr has been more accurate than Wall Street in forecasting EPS and revenue 75% and 50% of the time respectively throughout only 4 estimates. Estimate confidence ratings are calculated through algorithms developed by deep quantitative research which looks at correlations between analyst track records and tendencies as they relate to future accuracy. In this case bonefishr is making a bullish call expecting JNJ to beat the Street’s expectations on both EPS and revenue.
In 2013 JNJ beat analyst expectations in each quarter and the stock rose 29.1% on the year. This quarter contributing analysts on the Estimize.com platform expect Johnson & Johnson to continue the trend and beat the Wall Street consensus by 1c per share on earnings and $96 million in sales.
Get access to estimates for Johnson & Johnson published by your Buy Side and Independent analyst peers and follow the rest of earnings season by heading over to Estimize.com. Register for free to create your own estimates and see how you stack up to Wall Street.


