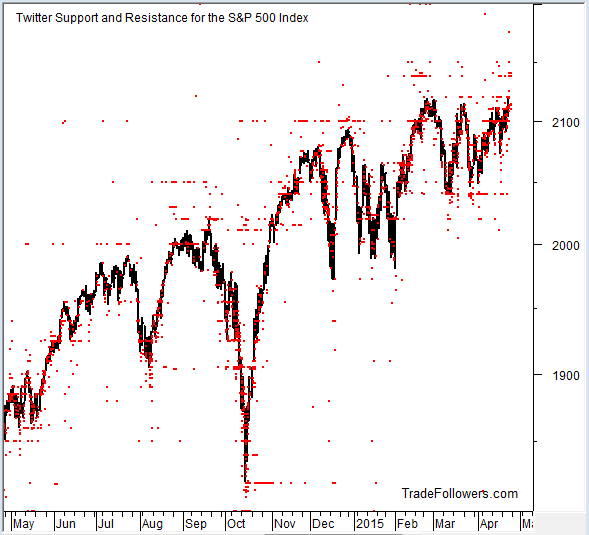
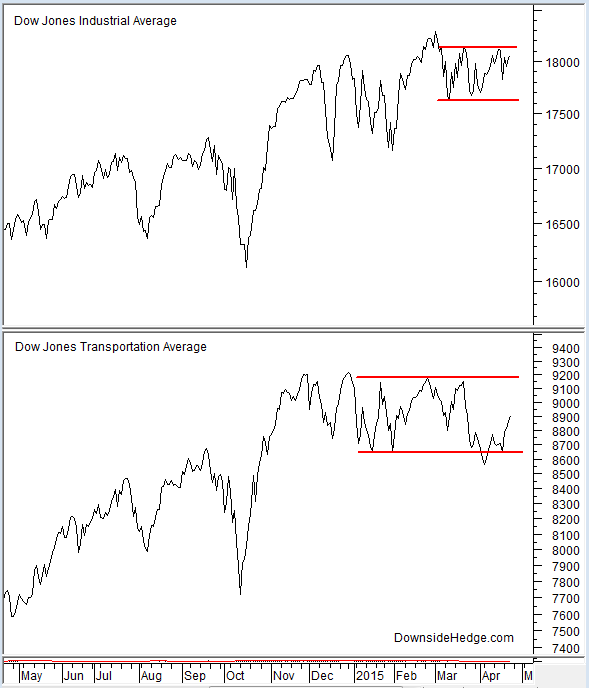
Another week gone and the market is still in a range. The S&P 500 index (SPX) has climbed back to the top of the range at 2120, while the Dow Jones Industrial Average (DJIA) and Dow Jones Transportation Average (DJTA) are lagging a bit. As I mentioned last week the direction of the break in SPX, DJIA, and DJTA will point the direction of the next intermediate term trend. So we’re left waiting again this week for confirmation of the uptrend or a rejection at the current level which will result in more time waiting.
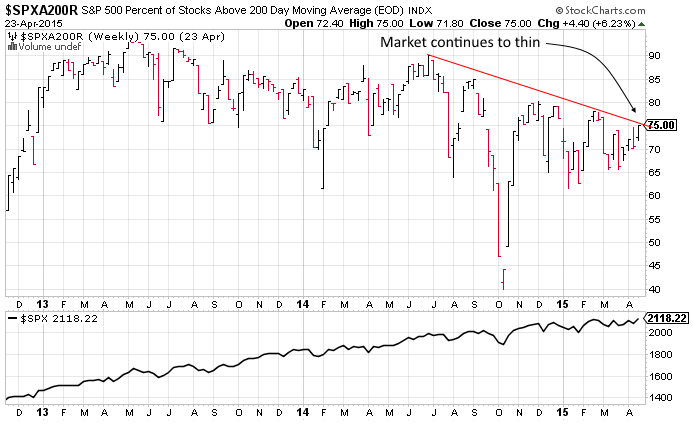
On thing I’m watching on a longer term scale is the continued negative divergence from several indicators. Negative divergences aren’t good timing devices for the simple fact that they can last for month or years, but they do provide important information if price declines. The percent of stocks above their 200 day moving average has been diverging from price for over two years (although from abnormally high levels). This indicates that market participants are getting more selective and value oriented in their purchases. If price now declines and breaks below the range (2040 on SPX) with the percent of stocks above their 200 dma falling below 60% it would indicate that market participants are no longer looking for value. The longer this negative divergence lasts the more likely the 60% level will be broken and a good correction will be underway.
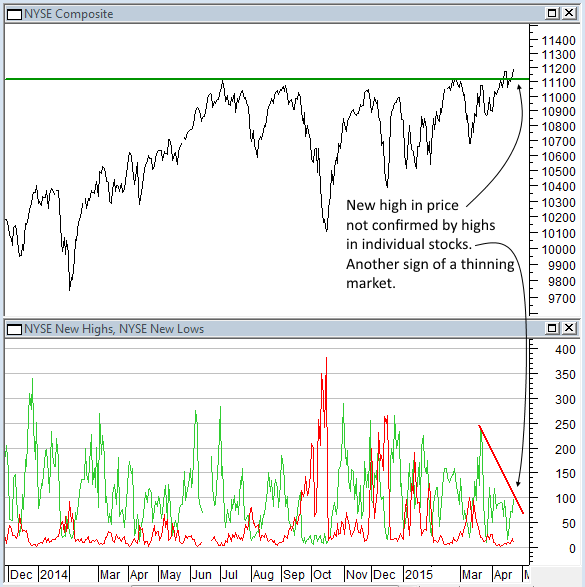
Another sign that market participants are interested in value comes from NYSE new highs and lows. The number of new highs are diverging from price as it move higher. The number of new lows continues to be low. That indicates investors are buying beaten up stocks and are reluctant to chase price in stocks near their 52 week highs. Bulls want to see the number of new highs increase quickly with any further price advance. Bears want new lows to increase as a sign that value buyers have been overwhelmed by fearful sellers.
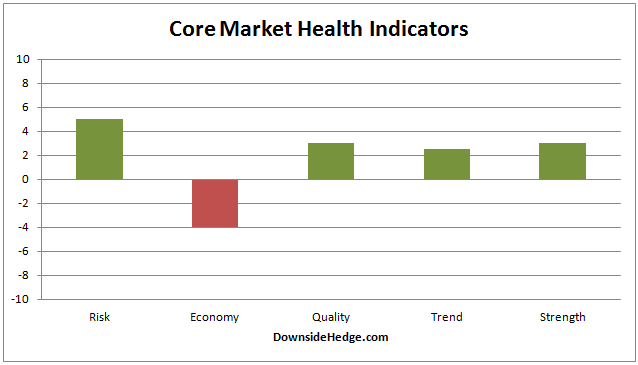
Our market health indicators mostly rose this week which increases the odds that the market will break out to the upside. Our measures of the economy are still mired in negative territory which keeps the core portfolios with a small hedge.
Bottom line I’m watching for a break from the range with confirmation from the indicators I follow. If that occurs the next intermediate term trend will be underway.