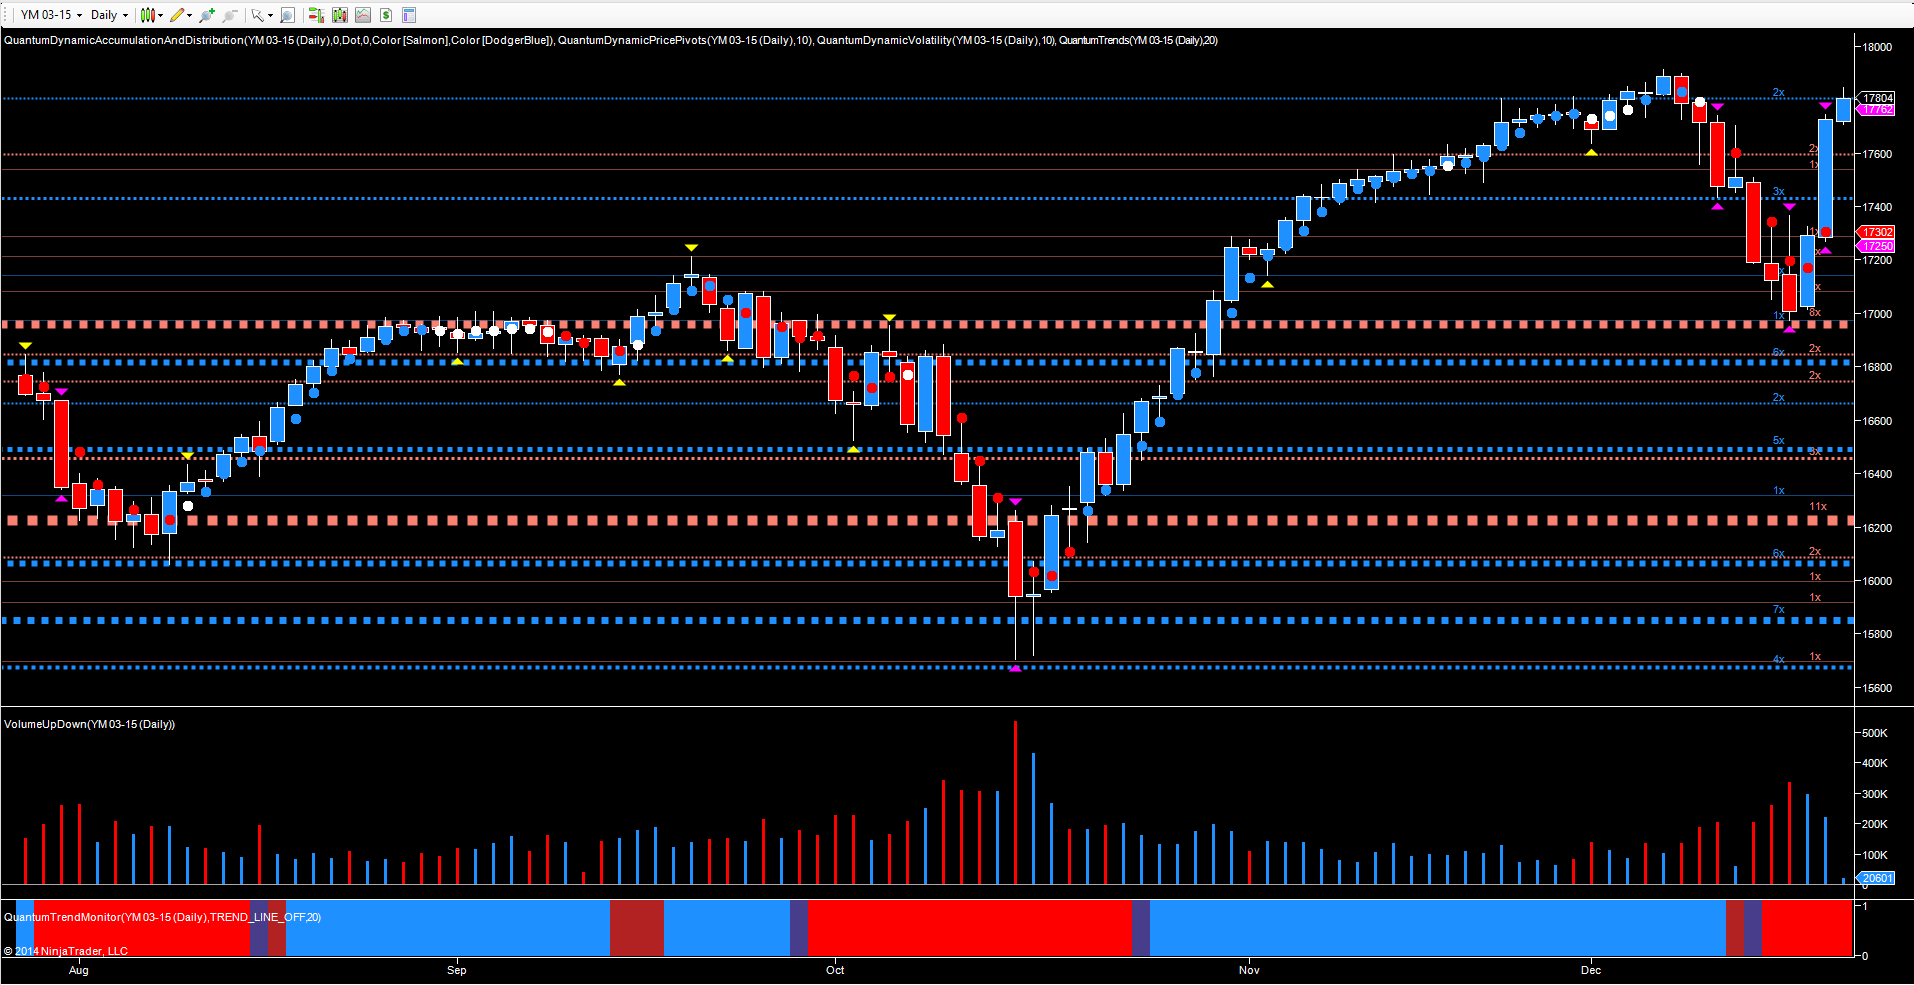
I wrote a post last week entitled the Alice in Wonderland World of the markets in which I confidently stated that the present market correction, particularly in indices and equities was just that, and not as many were forecasting, what I have christened “The Big Short”. The question I was asked at the time was how could I be so confident in my appraisal of the market. And the answer is simple – its volume.
As with the previous market correction of 19th September, neither of these moves have been preceded by a ‘selling climax’ which always heralds the arrival of a major reversal. The characteristics of a ‘selling climax’ (which you can read about in detail in my book ‘A Complete Guide to Volume Price Analysis’ – 134 5* reviews) is that phase of price action where we have an extended period of price congestion contained within a relatively narrow range. The price action is punctuated with a variety of narrow spread candles, shooting star and doji candles, all accompanied with high or ultra high volume. It is this crucial combination which signals the big operators are preparing to take the market down and fast. However, in anticipation of the move lower we will also need to see a number of low volume tests to confirm any final buying (by the retail traders and investors) has been absorbed before the main move can commence.
On neither occasion, in the reversal of September nor in the move of the last two weeks, has any selling climax been in evidence, either in the futures markets or in the related cash markets, all of which confirmed this was simply a short term correction, and not a major top. For the YM Emini on the daily chart, it was the deep area of support in the 16,950 region which duly provided the platform for the recovery with the FOMC proving to be the catalyst for the present recovery. This also confirms the nonsense written about oil being the primary driver of the current move lower for equities. Oil has continued lower, and is set to move lower still (and possibly down towards $43 per barrel), yet the markets have bounced back. The supposed relationship between oil and equities has simply been the mechanism the insiders have used as a trigger for further accumulation, aided and abetted by the media.
That operation now complete, the markets will continue to move higher, fueled by the panic selling which resulted from the sharp move lower. The Santa Claus rally is firmly back on track with Santa’s sled now extricated from the snow drift, and with the YM now trading at 17,810, and looking set to regain the 17,914 high of early December equities and indices should end the year in positive mood. For 2015, expect more of the same, and as always when the big short does finally arrive, you will be the first to know!
